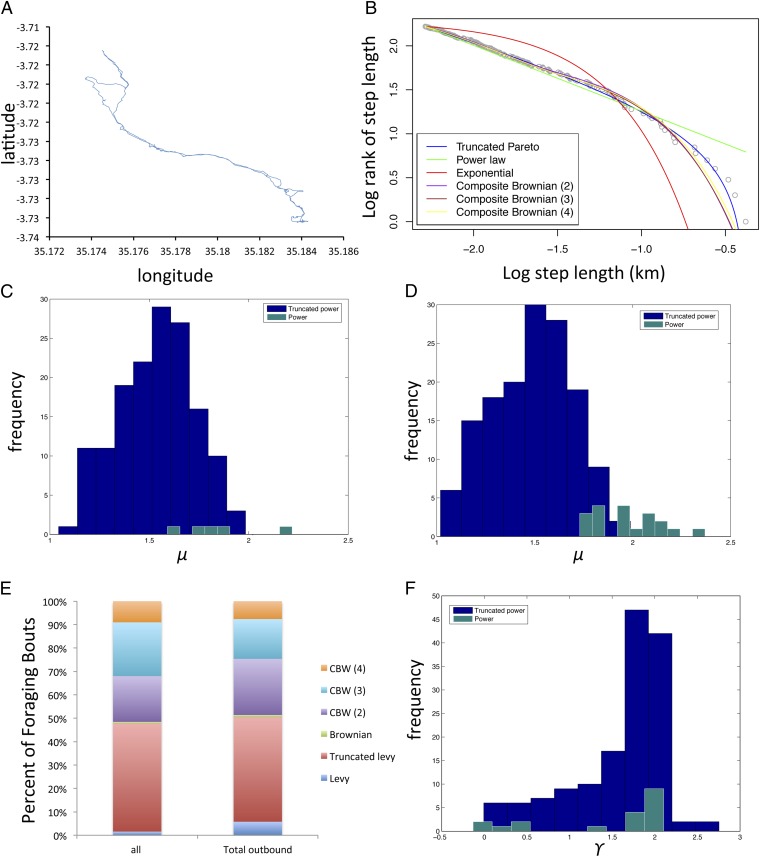
Fig. 2.
Model fitting for move step lengths. (A) Example of GPS data from foraging bout for a Hadza male. (B) Rank frequency plot of step length distributions showing model fits (truncated power law is the best fit model in this instance using AIC model selection criteria). (C) Histogram of μ from all foraging bouts best fit by truncated power laws and power laws. (D) Histogram of μ from the outbound portions of all foraging bouts best fit by truncated power laws and power laws. (E) Percentage of foraging bouts significantly fit by a given model. (F) Histogram of γ for the relationship between time and squared displacements of outbound portion of foraging bouts.

