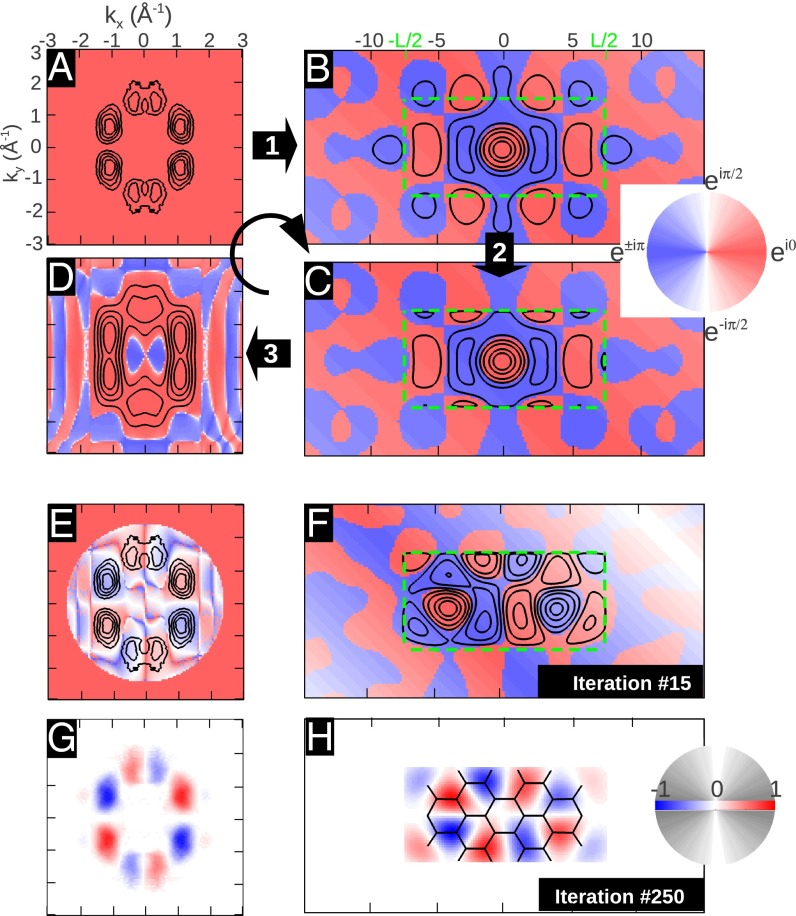
Fig. 2.
Iterative wave function reconstruction algorithm, using the example of the PTCDA HOMO. (A) Experimental ARPES momentum map. Black isolines represent the square root of the measured intensities, whereas the color indicates the phase. An inverse FT leads to B. The absolute value of the wave function is reduced to 10% outside the confinement box (green, dashed rectangle) in C; its FT leads to D. E and F, and G and H show the 15th and 250th step in the iterative procedure, respectively. In G and H, we show the real part of the reconstructed wave function, in k space and real space, respectively.

