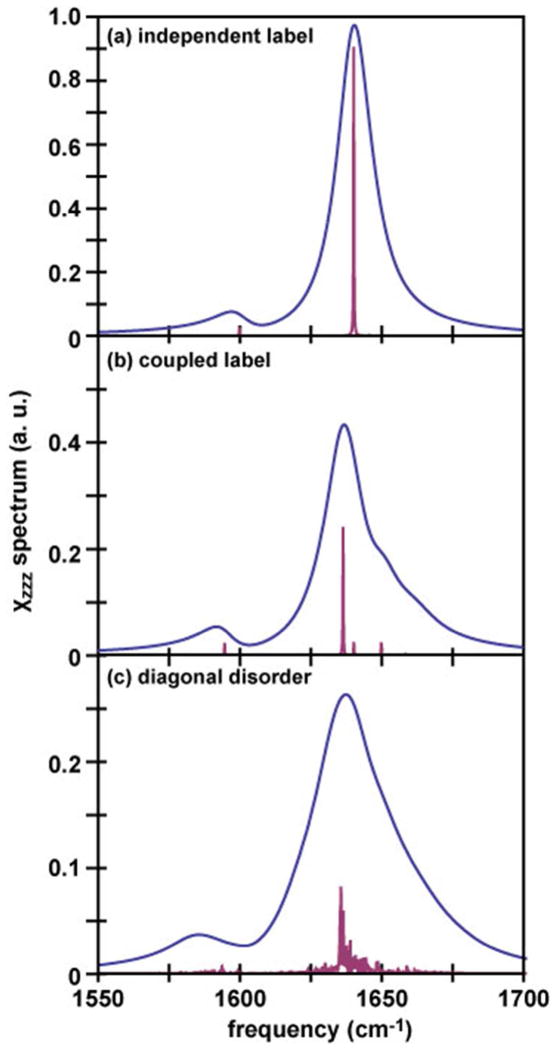
Figure 5.
Simulated spectra showing (a) a 13-residue ideal helix, with the isotope label calculated independently of (or uncoupled from) the rest of the helix, (b) a 13-residue ideal helix with the isotope label incorporated into and coupled with the other residues in the helix, and (c) a 13- residue ideal helix summed over 50 spectra with 16 cm−1 random disorder in the local mode frequencies. Spectra were simulated using a 15 cm−1 Lorentzian for each mode. Stick spectra (purple) are also included to emphasize how the normal mode structure changes as the couplings are broken.

