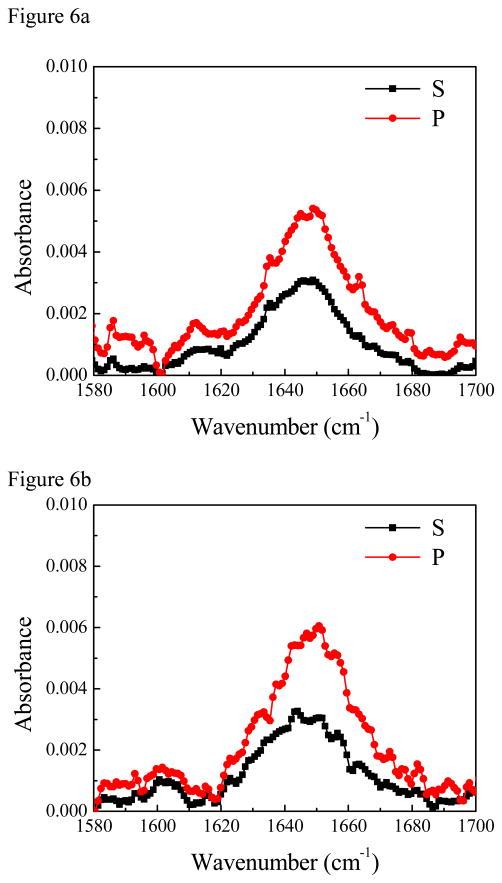
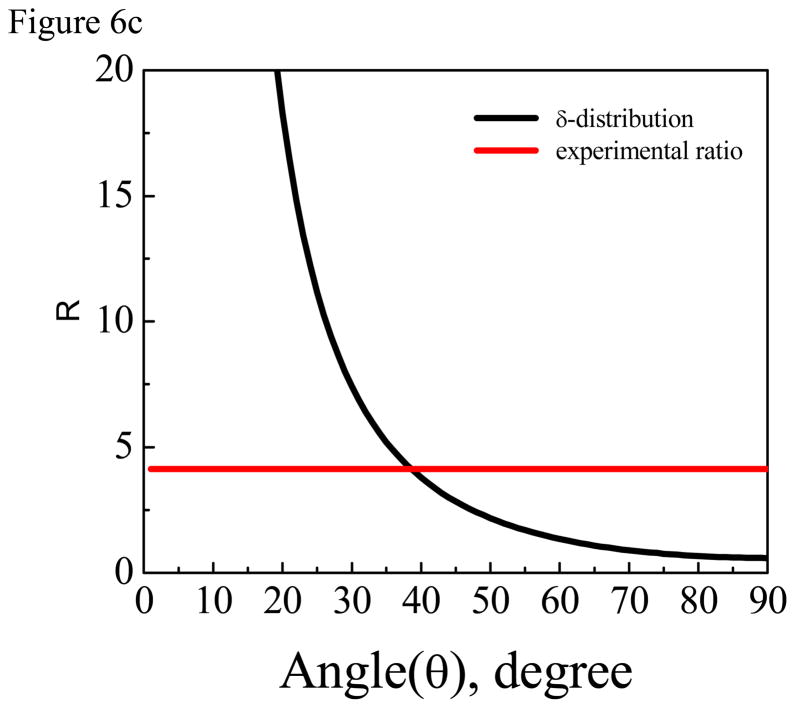
Figure 6.
(A) ATR-FTIR spectra of isotope labeled ovispirin-1 molecules at the PS/peptide solution interface. (B) ATR-FTIR spectra of regular ovispirin-1 molecules at the PS/peptide solution interface. (C) The relationship between the dichroic ratio R of the isotope labeled C=O stretching peak and the tilt angle of the C=O bond direction relative to the surface normal. The dichroic ratio R of the isotope labeled C=O stretching peak detected at the PS/peptide solution interface is shown as a horizontal line.


