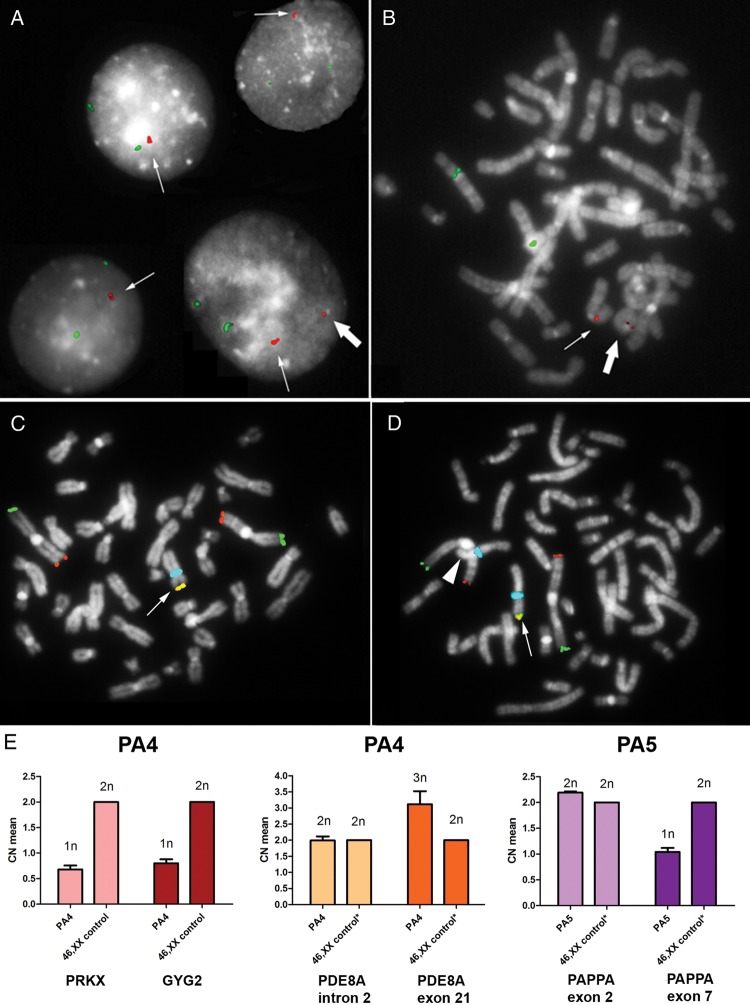
Figure 2.
Validation and structural characterization of the identified CNVs. (A) iFISH analysis performed on 100 nuclei from patient SM1 characterized the rearrangement involving BMP15 earlier identified by array-CGH analysis as a tandem duplication (thin arrow). In the 9% of the cells an additional smaller signal was identified (big arrow) which represents the low-level mosaic euploid cell line carrying a ring(X) chromosome as seen in the patient's metaphases (B). The BAC probe CTD-2004N6, specific for BMP15, is shown in red and the CEP6 probe (locus D6Z1) is in green. (C and D) Multi-colour FISH analysis on metaphases from patient PA4 identified both the 45,X (C) and the 46,XX (D) cell lineages, and confirmed the presence of a heterozygous Xp terminal deletion in the euploid cell lineage (D), as demonstrated by the loss of the expected subtelomeric Xp signal (arrowhead) compared with the conserved X chromosome (arrow). The TelVysion 1p probe is shown in green, the TelVysion 1q is in red, the TelVysion Xp/Yp is in yellow (red + green merged) and CEPX (locus DXZ1) is in blue. (E) Real-time quantitative PCR on gDNAs from patients PA4 and PA5. PA4's copy number (CN) profile for both the PRKX and GYG2 genes, located at Xp22.32, showed only one copy of both genes (predicted CN = 1n), and confirmed the heterozygous duplication of part of the PDE8A gene, located at 15q25.3, by comparing the regions within (dark orange bar, 3n) and outside the duplication (light orange bar, 2n). The CN profile of patient PN5 identified the heterozygous deletion interrupting the PAPPA gene, located at 9q33.1, by comparing the region not affected (light purple bar, 2n) with the deleted one (dark purple bar, 1n). All samples were also compared with 46,XX control (calibrator) gDNA. *The CN profile of the interested regions has been previously tested by array-CGH analysis. Calculated mean CNs are shown on the left-axis, while predicted CNs are displayed on the top of each bar. SD, standard deviation, is represented by the error bars (CN means of the calibrator have been calculated as 2n by the analysis software and therefore no SD values are shown).

