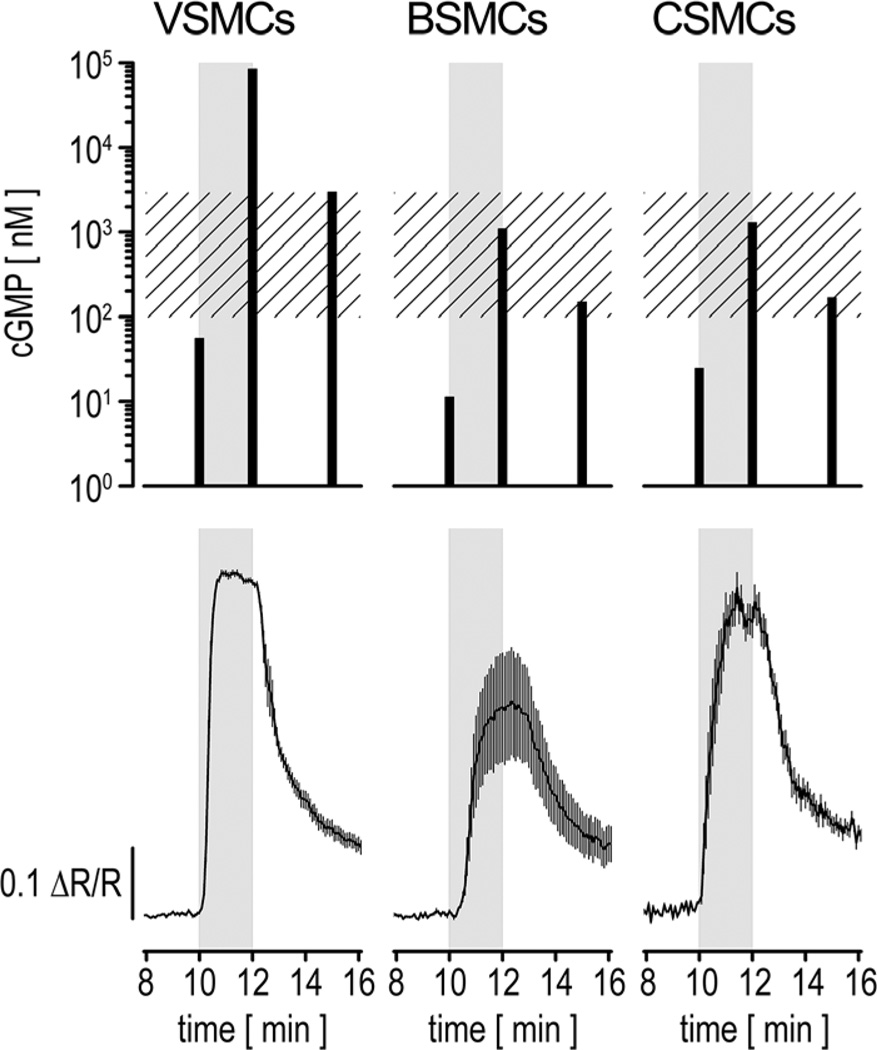
Figure 2. Comparison of nitric oxide (NO)–induced cyclic GMP (cGMP) changes measured by ELISA and fluorescence resonance energy transfer (FRET) imaging.
Primary vascular smooth muscle cells (VSMCs), bladder smooth muscle cells (BSMCs), or colon smooth muscle cells (CSMCs) were stimulated for 2 minutes with 200 nmol/L 2-(N,N-diethylamino)-diazenolate-2-oxide diethylammonium salt (DEA/NO; gray rectangles). For ELISA measurements (upper), cell extracts were prepared shortly before (t=10 minutes), at the end of (t=12 minutes) the DEA/NO simulation, and 3 minutes after DEA/NO removal (t=15 minutes). For each time point, cells from 2 wells of a 6-well plate were pooled, and samples were measured in duplicate. Intracellular cGMP concentrations (black bars) were estimated from a cell number of 122 000 cells per measured sample and an approximate cell volume of 1 pL.22 Note that basal cGMP concentrations (t=10 minutes) for all cell types and the cGMP content in VSMCs at t=12 minutes represent extrapolations because the original readings were not within the calibration range of the ELISA. The hatched rectangle indicates the dynamic detection range of cGMP indicator with an EC50 of 500 nmol/L (cGi500) for cGMP. For FRET imaging (bottom), cells were grown and stimulated under conditions similar to the ELISA experiment. Cells were continuously superfused with buffer at 1 mL/min and stimulated with DEA/NO after 10 minutes. Images were acquired every 5 seconds. Averaged recordings of 5 VSMCs, 4 BSMCs, and 8 CSMCs are shown (mean±SEM). Cells for ELISA and FRET experiments were isolated from wild-type and R26-CAG-cGi500(L1) mice, respectively.

