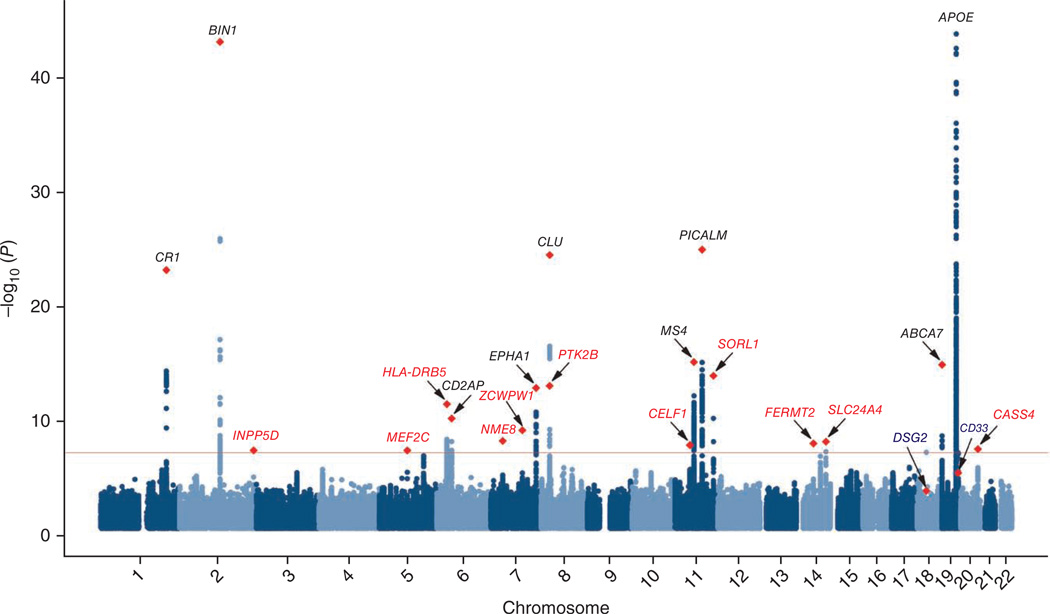
Figure 1.
Manhattan plot of stage 1 for genome-wide association with Alzheimer’s disease (17,008 cases and 37,154 controls). The threshold for genome-wide significance (P < 5 × 10⁻⁸) is indicated by the red line. Genes previously identified by GWAS are shown in black, and newly associated genes are shown in red. Red diamonds represent SNPs with the smallest P values in the overall analysis.

