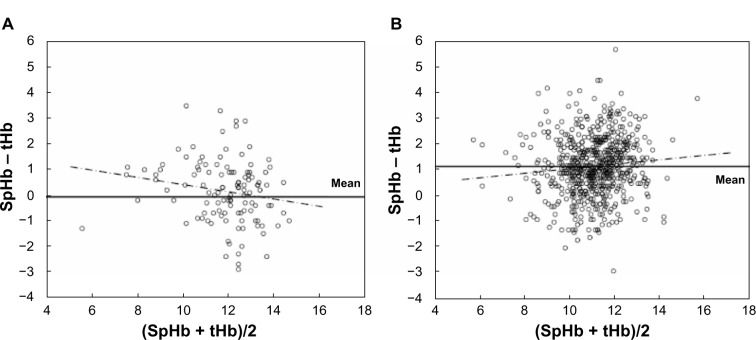
Figure 4.
Bland–Altman comparison of SpHb and tHb of the two categories.
Notes: Horizontal lines are drawn at the mean bias, and horizontal broken lines are drawn at the limits of agreement. The chained lines demonstrate the regression lines in both categories. (A) Nonpregnant and first trimester of pregnancy. (B) Second and third trimester of pregnancy and postpartum period.
Abbreviations: SpHb, percutaneous hemoglobin; tHb, total hemoglobin.

