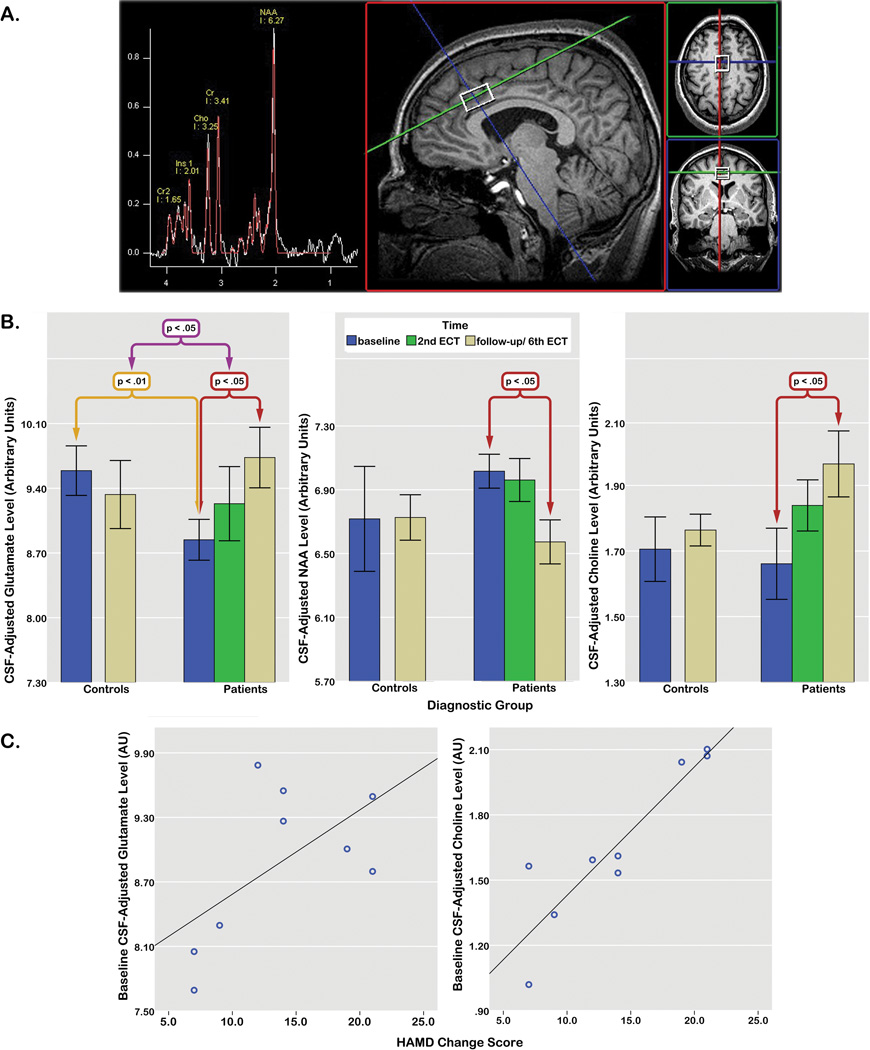
Figure 1.
A) Voxel placement and 1HMRS spectra in a single subject, B) Mean CSF-adjusted glutamate (left), NAA (middle) and choline (right) levels at each time point in patients and controls indicating significant disease effects (purple), group by time interactions (yellow), and differences between metabolite levels at baseline compared to the 6th ECT session in patients (red). The linear effect of time for glutamate within the patient group is not marked, C) relationships between HAMD change scores (subtracted between baseline and the 6th ECT session) and baseline glutamate (left) and choline (right) levels in patients. One data point is missing for a single patient (from the 6th ECT session) for B and C above.

