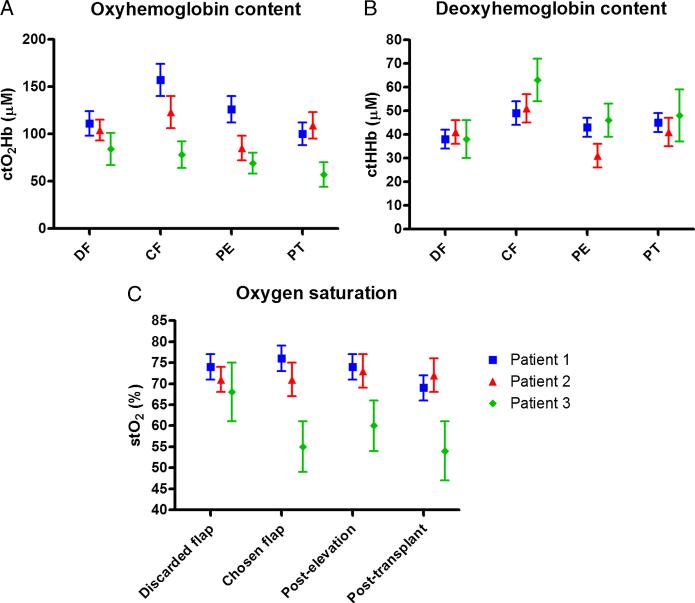
FIGURE 6.
Quantification of SFDI oxygenation imaging results. Localized measurements from similar regions of interest were quantified and their mean and standard deviation plotted. (A) Tissue oxyhemoglobin content, (B) tissue deoxyhemoglobin content, and (C) tissue oxygen saturation levels were evaluated for all 3 patients.

