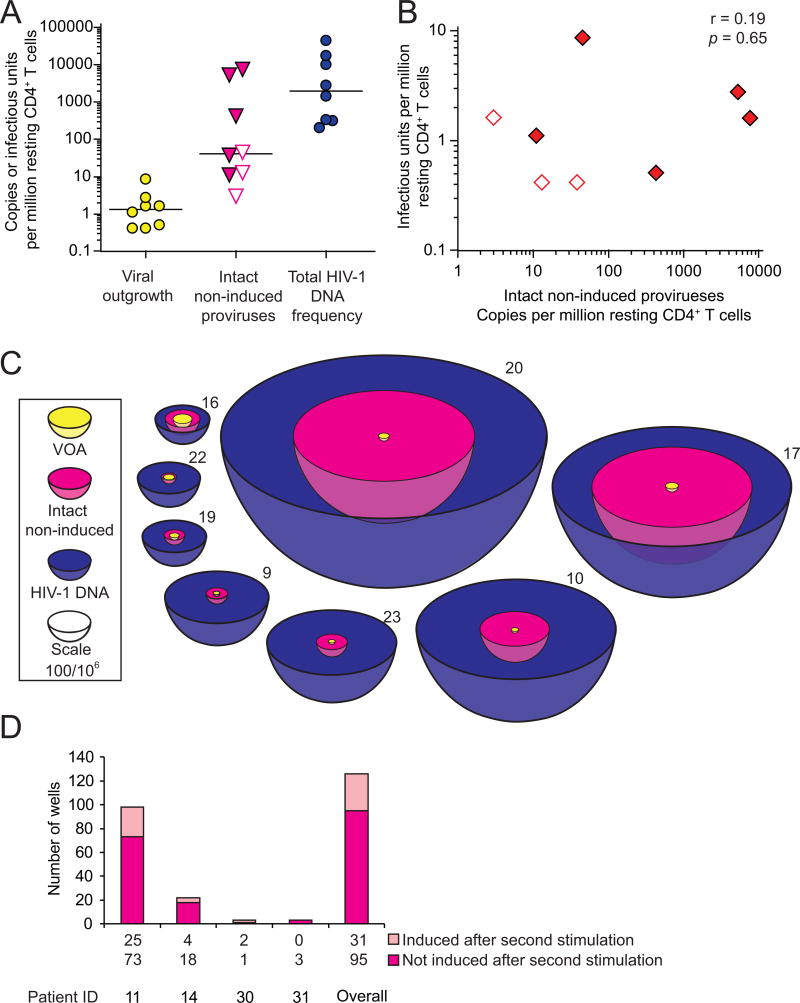
Figure 7. Quantification of intact non-induced proviruses.
(A) Comparison of the frequency of cells detected in the VOA, cells carrying intact non-induced proviruses, and cells carrying HIV-1 DNA. The frequency of cells with HIV-1 DNA was measured by quantitative PCR on freshly isolated resting CD4+ T cells. The frequency of cells with intact, non-induced proviruses was calculated as frequency of cells with HIV-1 DNA times the proportion of intact non-induced proviruses estimated for each patient using an empirical Bayesian model (Table S2). Open symbols, no intact proviruses detected, empirical Bayesian estimate plotted. Bars, median value.
(B) Correlation between the frequency of cells detected in the VOA and the frequency of cells with intact non-induced proviruses. Open symbols, see (A).
(C) Scale representation of the frequencies of the infected resting CD4+ T cell populations. Volume reflects population size. Yellow circles, minimum size of the LR as measured by VOA. Magenta, frequency of cells with intact proviruses, calculated as the frequency of cells detected in the VOA plus the frequency of cells with intact non-induced proviruses. This is the potential size of the LR if intact non-induced proviruses can be induced in vivo. Blue, cells with HIV-1 DNA.
(D) Repeated stimulation induces additional proviruses. Bars indicated p24 ELISA results from pairs of split wells cultured with or without a second round of stimulation with PHA and irradiated allogeneic PBMC.
See also Figure S5 and Table S2.

