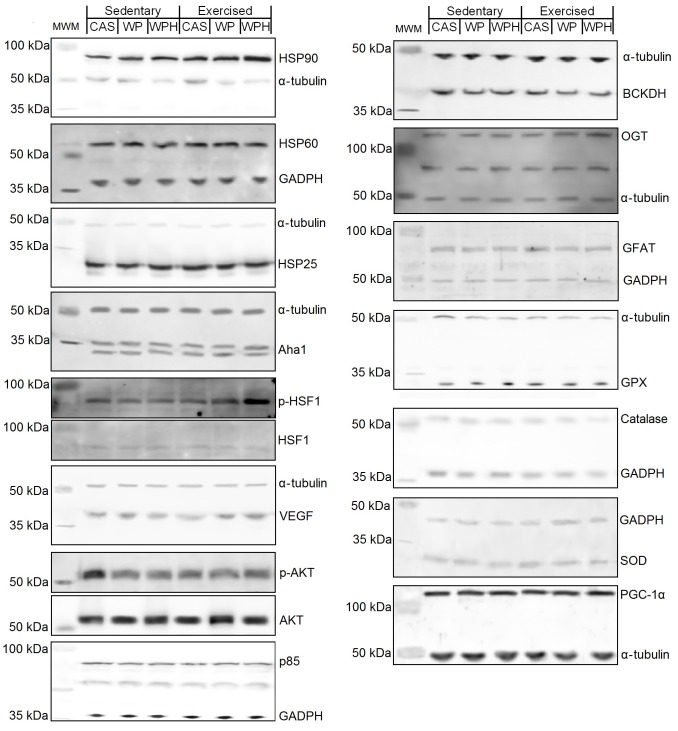
Figure 2. Exercised groups were subjected to five sessions on a treadmill at the speed of 22/min for 30 minutes during the last week of the diet treatment.
The data were obtained from gastrocnemius collected 6(n = 8 per group). The dietary proteins were consumed for 3 weeks. Mean and standard error for the blood analysis of: Albumin (A), total protein (B), uric acid (C), glucose (D), LDH (E), CK (F), AST (G), ALT (H), urea (I), creatinine (J). Protein sources: whey protein (WP), whey protein hydrolysate (WPH), Casein (CAS) control. Six groups: Sedentary CAS (control), Sedentary WP, Sedentary WPH, Exercised CAS, Exercised WP and Exercised WPH. All values were compared and related to CAS sedentary (protein source control) and reported as %CAS value. Different letters represent significant differences.

