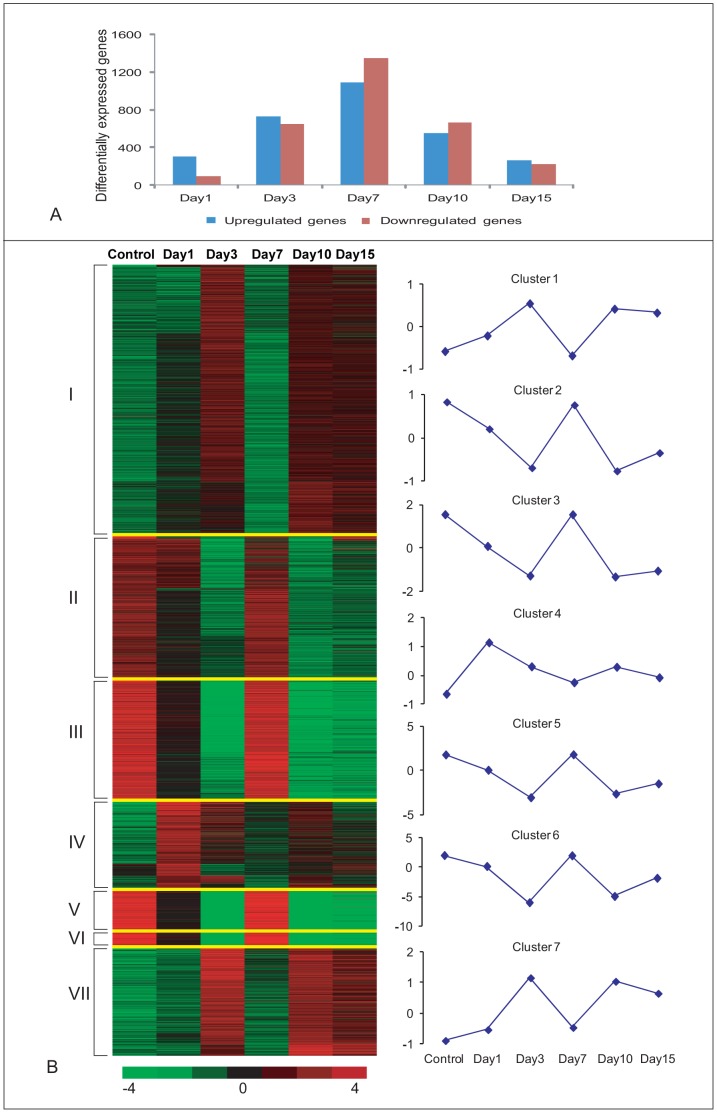
Figure 1. K-means Clustering Analysis of Differentially Expressed Genes before and after SCI in zebrafish.
A) Distribution of differentially expressed genes both up-regulated and down-regulated after SCI at different time points. B) A set of 3,842 genes are identified as differentially expressed in at least one time point and are clustered into seven groups using the k-means algorithm. In the figure, horizontal lines indicate the expression pattern of each gene and the vertical columns indicate the time points after injury. The color chart indicates mean fold change of gene expression in each time points. Red and green colors represent increased and decreased expression respectively. Control = uninjured cord, Day 1 = 1 dpi cord, Day 3 = 3 dpi cord, Day 7 = 7 dpi cord, Day 10 = 10 dpi cord and Day 15 = 15 dpi cord. The clusters are separated by fine yellow lines. The average expression value of each cluster is plotted and shown in the line graph.

