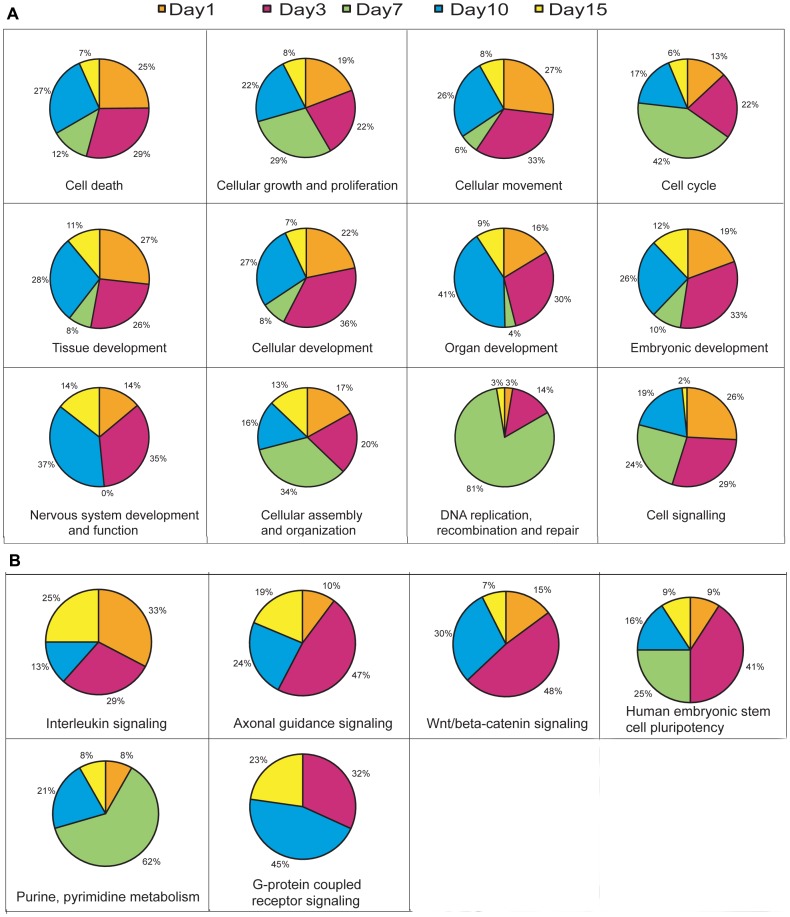
Figure 2. IPA analysis of biological functional groups and enriched pathways.
A) Pie charts showing the percentage of genes that are differentially expressed (both up and down regulated) at different time points for the various enriched functional groups in IPA analysis. B) Pie charts showing the percentage of genes that are differentially expressed (both up and down regulated) for the various enriched signaling pathways in IPA analysis at different time points after SCI.

