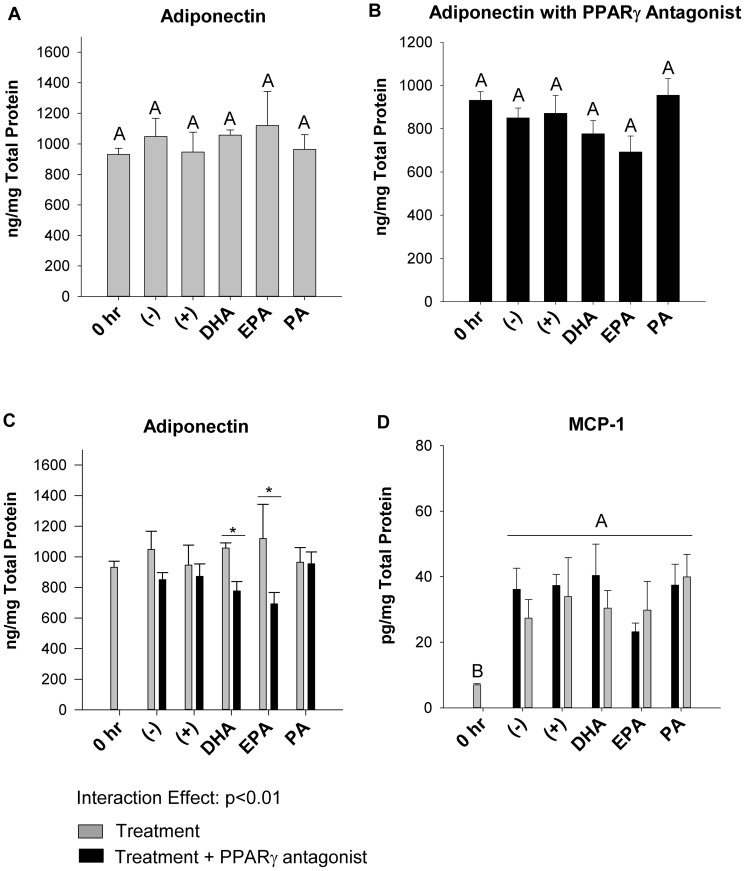
Figure 5. Effect of a Pparγ antagonist on adiponectin and MCP1 cellular protein in trans-well co-cultured adipocytes.
The cellular protein concentrations of adiponectin harvested from adipocytes the trans-well system at 12 hr alone (A) or with the PPARγ antagonist, T0070907 added (B), and a comparison of adiponectin (C) or MCP1 (D) cellular protein with and without the PPARγ antagonist added. 0 hr = serum starved adipocytes alone prior to co-culture and fatty acid treatment, (−) = negative control; adipocytes alone treated with 25 µM BSA, (+) = positive control; co-cultured adipocytes and macrophages plus 25 µM BSA, DHA = co-cultured adipocytes and macrophages in the presence of 125 µM DHA, EPA = co-cultured adipocytes and macrophages in the presence of 125 µM EPA, and PA = co-cultured adipocytes and macrophages in the presence of 125 µM PA. Values are means ± SEM. The experiment was independently conducted 2 times (in triplicate) for a final sample size of n = 6. A different letter or an asterisk (*) indicates treatments are significantly different from each other, p≤0.05.

