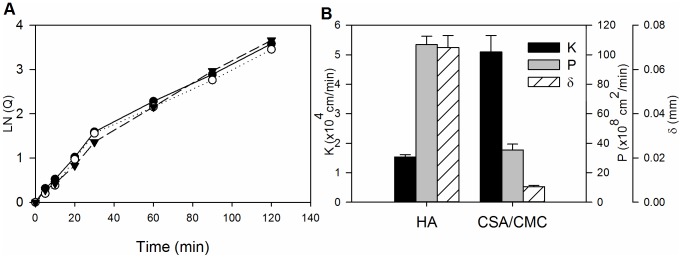
Figure 6. Albumin permeability measurements and mass transfer characteristics of HA and CSA/CMC capsules.

(A) Representative plots of the concentration factor ln(Q) vs. time for three replicate runs with the CSA/CMC capsule formulation. (B) Plots of permeability coefficient (P), overall mass transfer coefficient (K) and wall thickness (δ) for the HA and CSA/CMC capsule formulations. Error bars represent the standard deviation of three replicate measurements.
