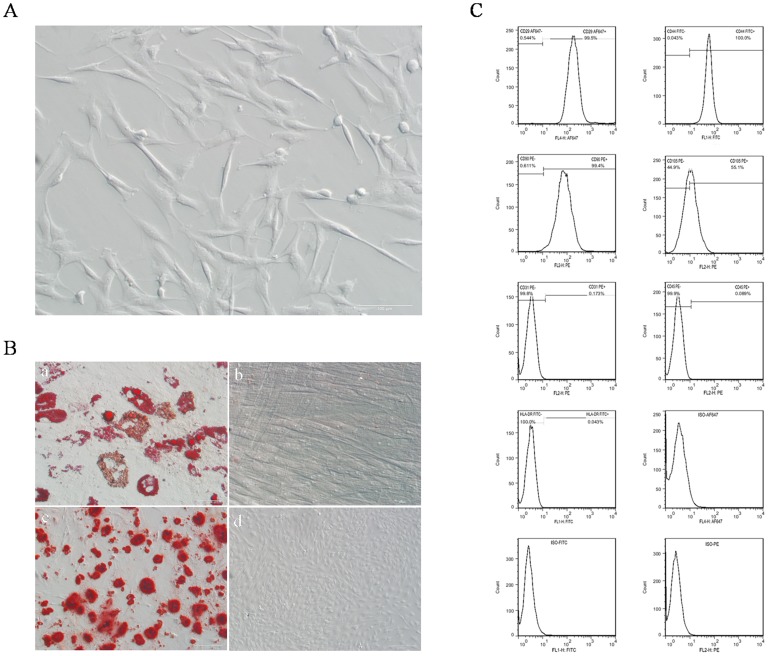
Figure 1. Identification of pADSCs.
(A) Morphology of pADSCs at passage 3, scale bar = 100 µm. (B) Multi-lineage differentiation of pADSCs, mature adipocytes were detected by Oil Red O staining (a), scale bar = 50 µm; osteogenesis was analysis by Alizarin Red S staining (c), scale bar = 200 µm. Cells cultured in the corresponding proliferation medium served as negative controls, respectively (b, scale bar = 50 µm; d, scale bar = 200 µm). (C) Expression of cell surface markers in pADSCs at passage 3 including CD29, CD44, CD90, CD105,CD31, CD45 and HLA-DR. Positive cells were gated based on staining with isotype antibody controls.

