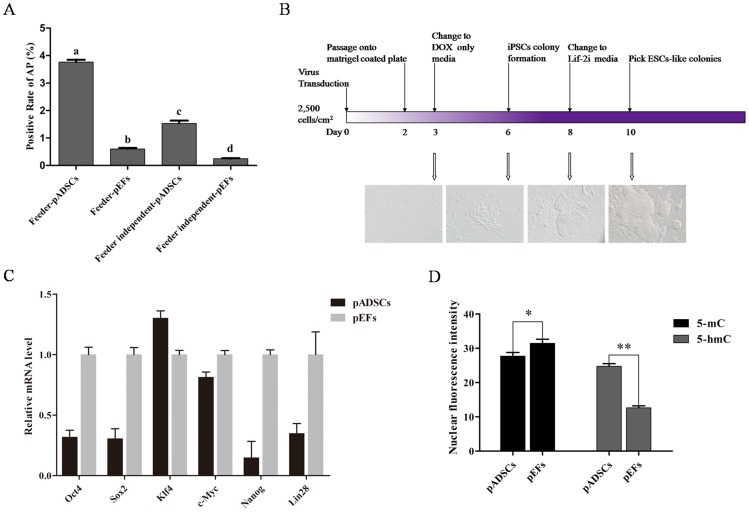
Figure 2. Generation of piPSCs from pADSCs.
(A) AP staining of colonies which were reprogrammed from pADSCs and pEFs in the presence of feeders and feeder-independent condition. The rate of AP positive colonies was compared between the groups, different superscripts above the bars denote significant difference (P<0.05). (B) Schematic of the reprogramming strategy and the, morphology of cells at day 3, 6, 8 and 10. (C) Expression levels of genes associated with reprogramming, including Oct4, Sox2, c-Myc, Klf4, Lin28 and Nanog were evaluated in pADSCs and pEFs. (D) Expression levels of 5-mC and 5-hmC were analyzed in pADSCs and pEFs by immunofluorescence staining, *P<0.05, **P<0.01.

