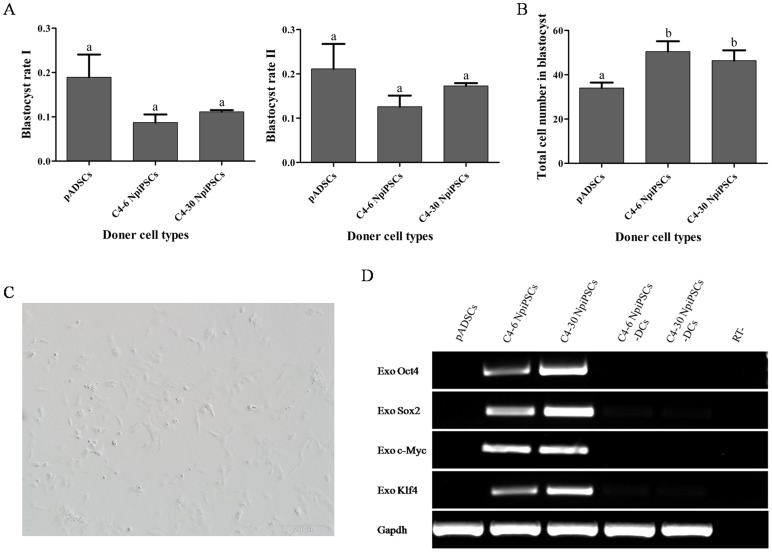
Figure 6. NpiPSCs for nuclear transfer.
(A) Blastocyst rate of nuclear transfer embryos from NpiPSCs and pADSCs. Blastocyst rate I = No. blastocyst/No. cultured embryos (a); Blastocyst rate II = No. blastocyst/No. cleaved embryos (b). Different superscripts above the bars denote significant difference (P<0.05). (B) Total cell number of blastocyst from NpiPSCs and pADSCs. (C) Spindle-like morphology of cells 24h after the withdrawal of DOX. (D) Reverse transcription PCR analysis of expression of exogenous genes 6 days after the withdrawal of DOX.

