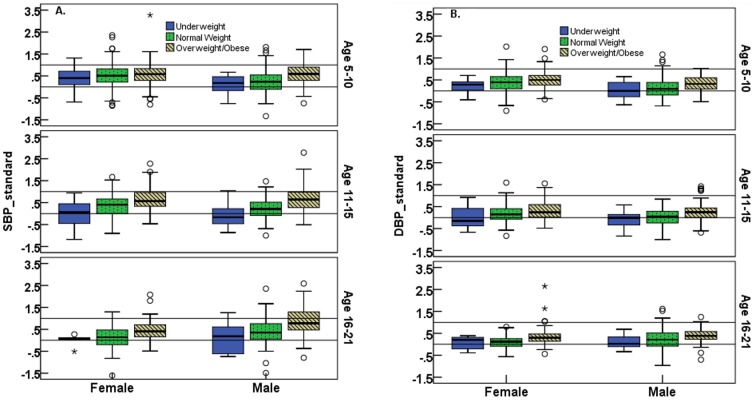
Figure 1. The relationship between blood pressure and children’s weight status.
Box plots of standardized systolic (1A) and diastolic (1B) blood pressure (BP), by age group, weight category [underweight (solid boxes), overweight (dotted boxes), obese (line boxes)], and sex. Standardization for age and sex was carried out by subtracting CDC 50th BP percentiles (%ile) from observed values, and dividing this by the difference between the 95th and 50th CDC BP percentile. Thus values > 0 correspond to values above the CDC median (50th% ile) and values > 1 correspond to values above the 95th% ile, i.e., hypertension.

