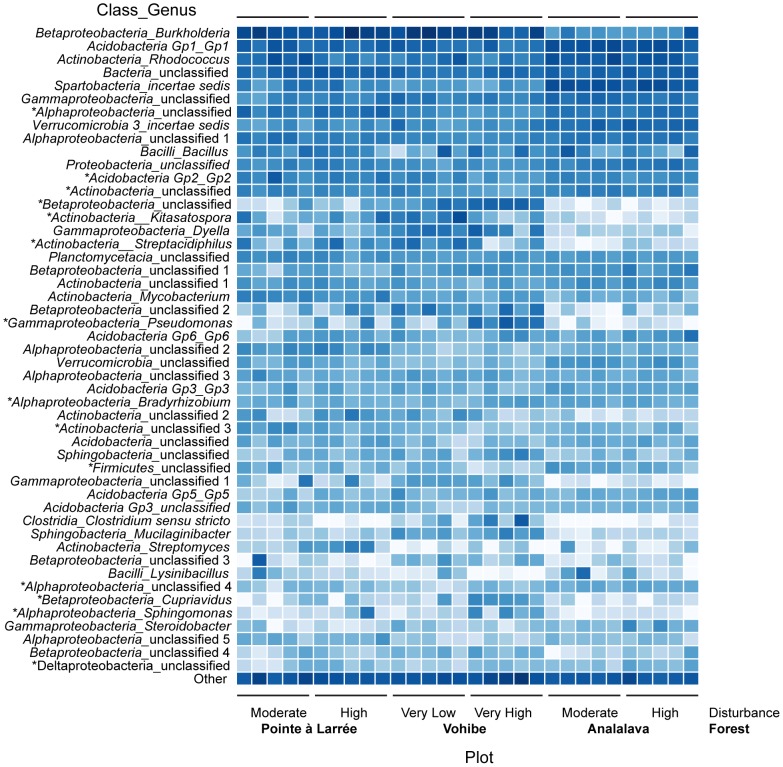
Figure 2. Log transformed abundance of dominant bacterial genera by sample.
Sequences in 3% OTUs were classified and grouped at the genus level. Taxa representing <0.3% of the total sequences were grouped as Other. Darker color indicates higher relative abundance. Asterisks indicate taxa with significant shifts in abundance between disturbance levels at Vohibe (see Table 5).

