Fig. 5.
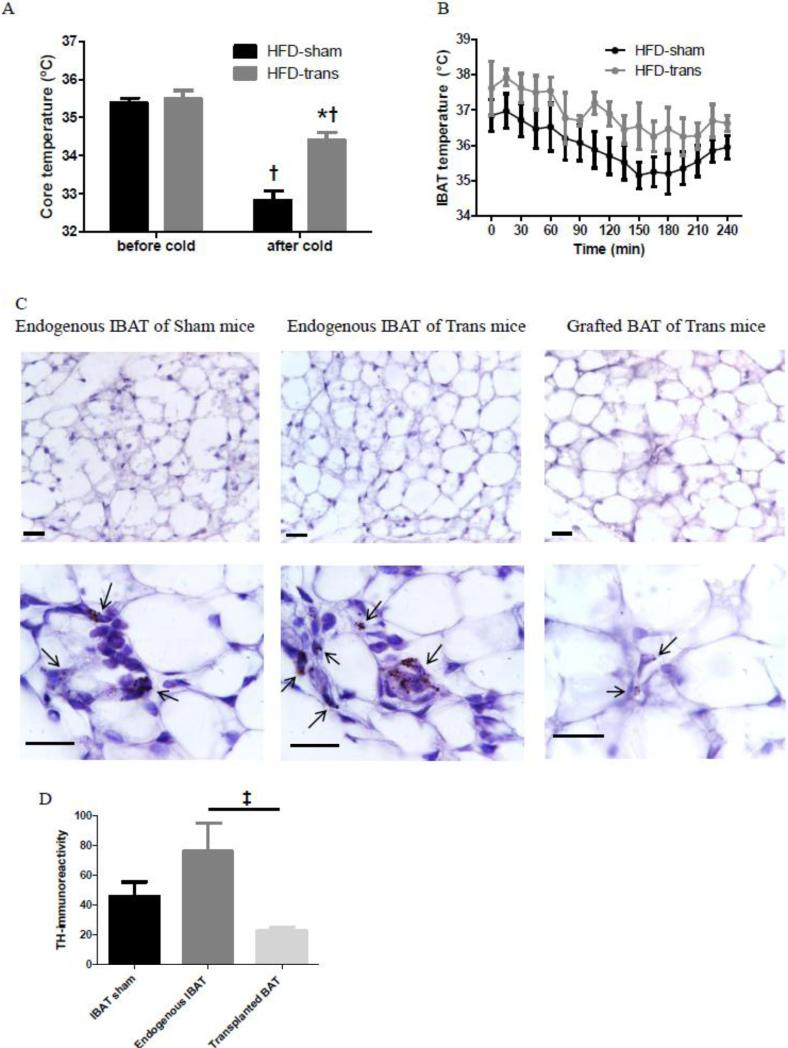
Whole-animal core temperature response (A), temperature response of endogenous IBAT (B) of HFD-sham and HFD-trans mice during 4-hour 4°C cold exposure, and immunohistochemical staining of tyrosine hydroxylase (TH) of endogenous IBAT of HFD-sham mice, and endogenous IBAT and transplanted BAT of HFD-trans mice (C, D) (Exp 4). Scale bar is 20 μm. Arrows indicate representative TH-positive staining.
HFD-sham: n=4; HFD-trans: n=4.
* Significant difference between HFD-sham and HFD-trans groups.
† Significant difference before and after cold exposure.
‡ Significant difference between endogenous and transplanted BAT of transBATed mice.

