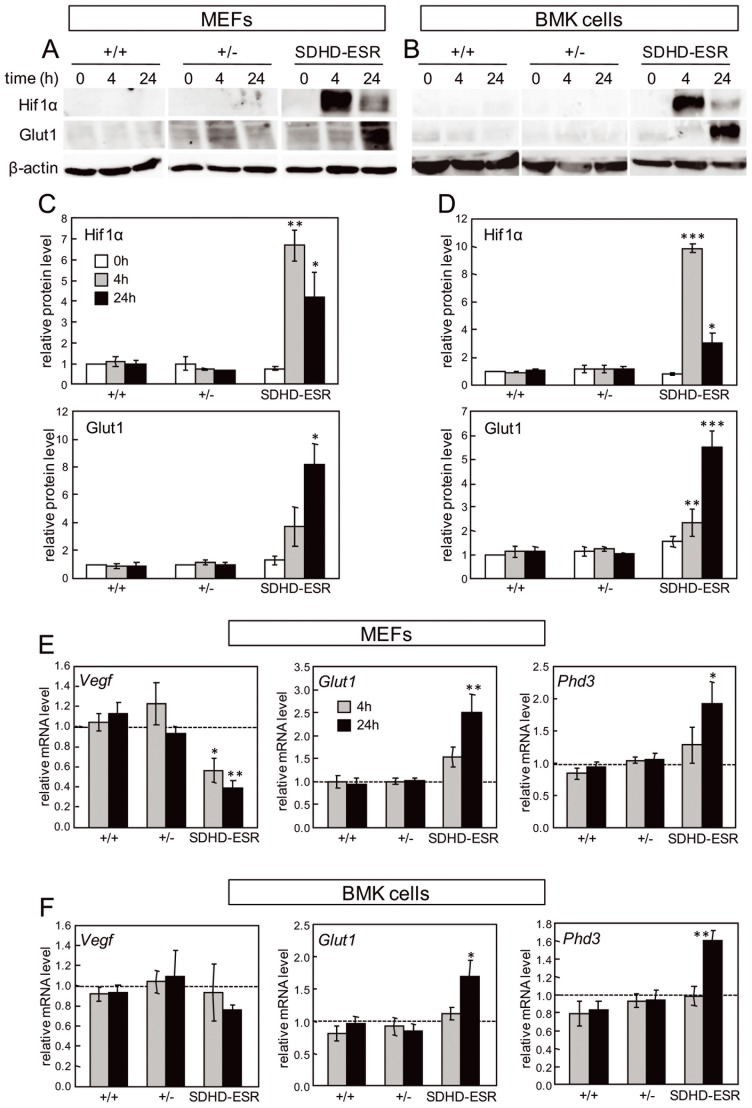
Figure 3. “Pseudo-hypoxic” response in SDHD-ESR MEFs and BMK cells.
A, B. Western blot of Hif1α and Glut1 in total protein extracts of (A) mouse embryonic fibroblasts (MEFs) and (B) baby mouse kidney (BMK) cells obtained from SDHD-ESR mice and their homozygous SdhDflox/ + (+/+) and heterozygous SdhDflox /− (+/−) littermates and cultured in medium supplemented with 4-hydroxy-tamoxifen for 4 or 24 hours. C, D. Quantification of relative Hif1α and Glut1 band intensities in (C) MEFs and (D) BMK cells normalized to β-actin signal. Results are the average ± SEM of three independent experiments. *, P≤0.05; **, P≤0.01; ***, P≤0.001; for 0 hours, i.e. in the absence of 4-hydroxy-tamoxifen, versus 4 or 24 hours of incubation in 4-hydroxy-tamoxifen. E, F. Messenger RNA levels of Vegf, Glut1, and Phd3 genes in (E) MEFs and (F) BMK cells cultured in the same conditions. *, P≤0.05; **, P≤0.01; Two different immortalized clones were generated for each genotype and cell type giving the same results. Only results from one of each are shown.

