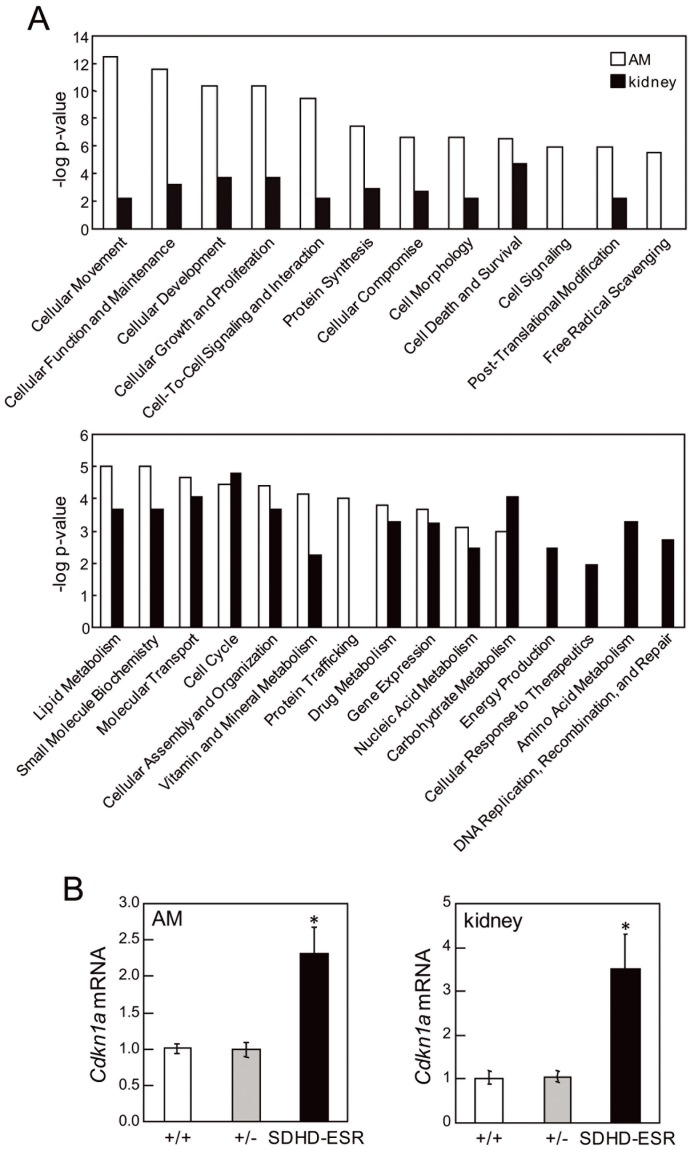
Figure 5. Functional analysis and validation of the microarray.
A. Comparative functional analysis of datasets generated from adrenal medulla (AM) and kidney samples from SDHD-ESR mice. The significance of each molecular and cellular function is indicated by –log of the p-value. B. Quantitative RT-PCR of RNA samples used in the microarray study based on specific primers for amplification of the Cdkn1a mRNA.

