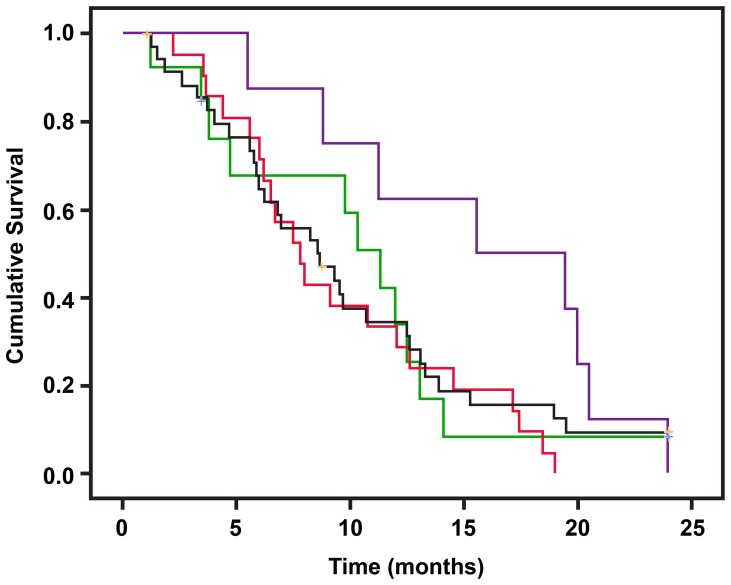
Figure 2. Overall survival of patients with various nuclear expression levels of TGF-βR2 and SMAD4.
Nuclear staining score 0–1 is defined as low for TGF-βR2 and a score 0 as low for SMAD4. Red line: TGF-βR2 is high and SMAD4 is low (HL); black line: both high (HH); green line: both are low (LL); purple line: TGF-βR2 is low and SMAD4 is high (LH). The median survival times are 7.8, 8.6, 11.3, and 15.6 months for the HL, HH, LL and LH groups, respectively. Log-rank test P values and results of Cox regression analysis are presented in Table 2. Thus, TGFβ-R2/SMAD4 ratio may be prognostic, with low values corresponding with an improved survival.

