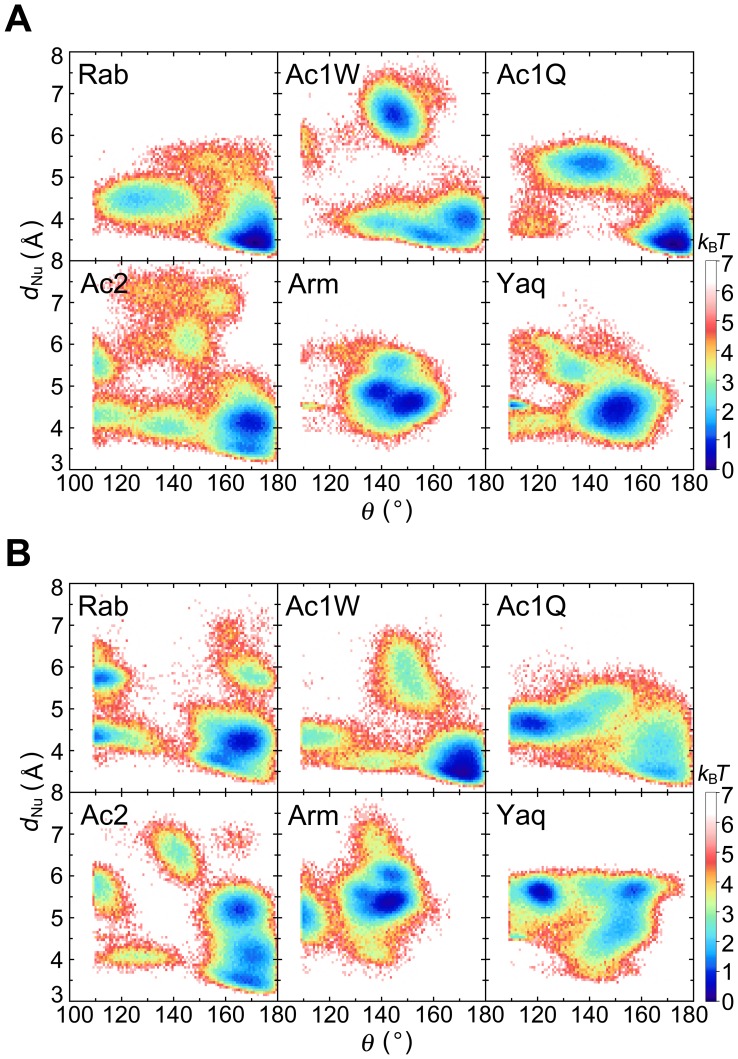
Figure 5. Spatial distribution of expected nucleophilic water.
Distribution of expected nucleophilic water as a function of angle θ and distance d Nu, as defined in the legend for Figure 4, converted as free energy scale at (A) 0.1 and (B) 60 MPa. A water molecule having the minimum d Nu value and a θ greater than 109.3° was assigned as the expected nucleophilic water in each simulation snapshot. The free energy was shown as the relative value against the minimum free energy in k B T.

