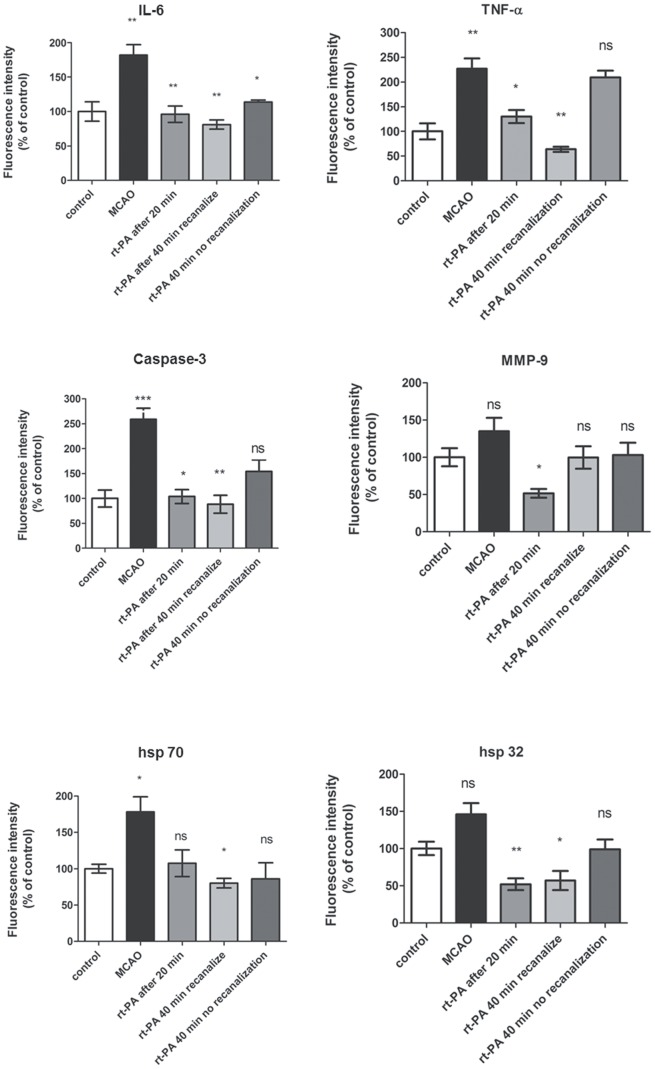
Figure 5. Bar graphs showing semi-quantification of fluorescence intensity for IL-6, TNF-α, Caspase 3, MMP-9, hsp 70 and hsp 32 proteins.
Data are presented as the mean percentage relative to control ± s.e.m.; n 5 = 9 *P≤0.05, significant difference between control groups and MCAO, # P≤0.05, significant difference between treated groups and MCAO groups. Statistical analyses were performed using Kruskal-Wallis non-parametric test together with Dunn’s post-hoc test.

