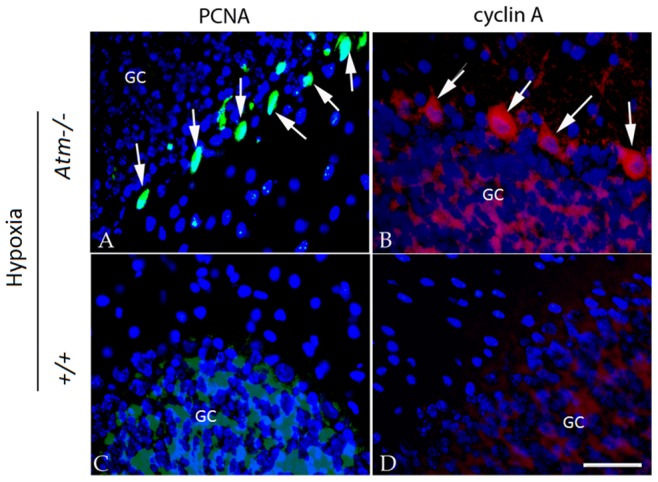
Figure 1. Cell cycle proteins increased in Purkinje cells of Atm−/− mice after hypoxia treatment.

The representative pictures from each group (n = 3–4, repeated 3 times) were shown. Expression of PCNA (A, C) and cyclin A (B, D) increased after hypoxia treatment. In each panel, white arrows indicate the Purkinje cells that stained with cell cycle markers. GC = granule cell layer, Scale bar = 25 µm.
