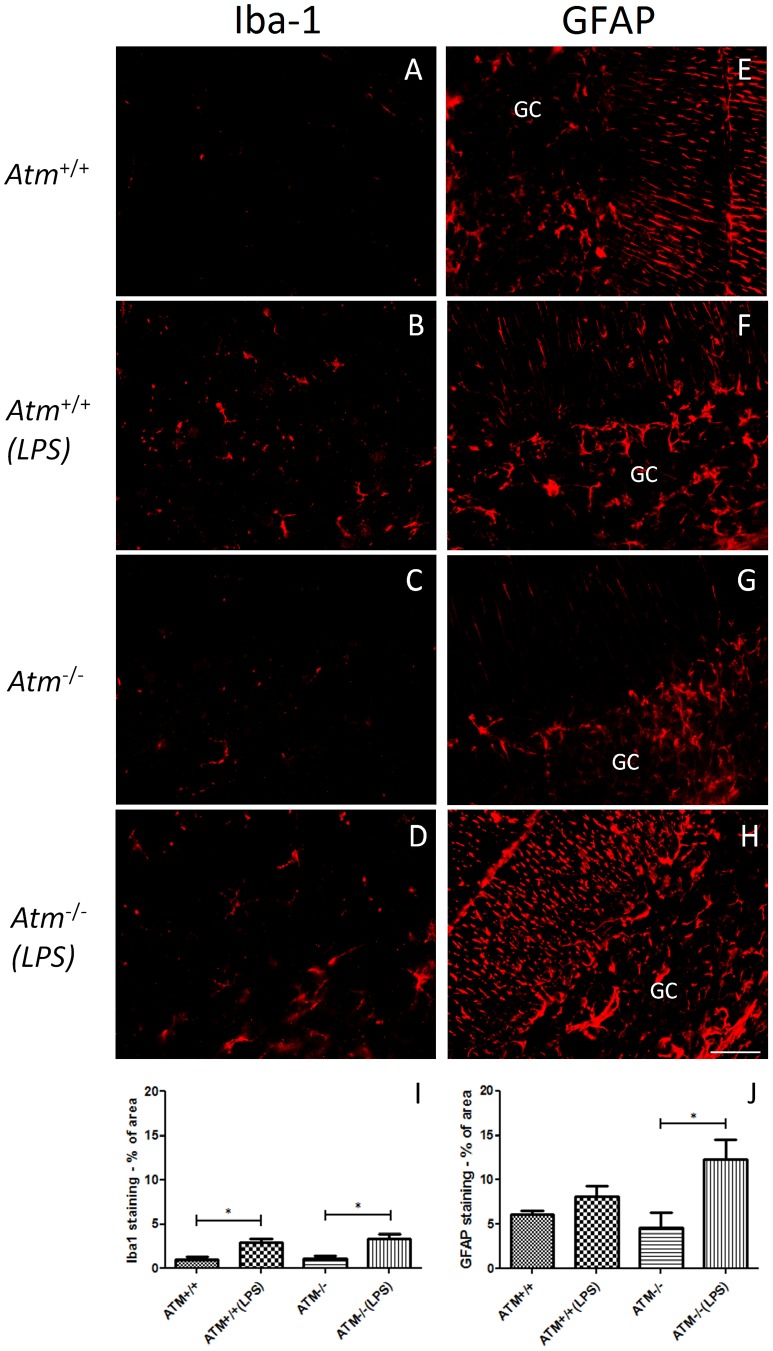
Figure 3. An inflammatory response was observed in both genotypes of LPS-induced mice.
The representative pictures from each group (n = 3) were shown. The microglial marker, Iba-1 was used to reveal the morphology of the brain microglia in both wild type (A–B) and Atm −/− (C–D) cerebellum. In saline-treated animals (A, C), the microglia appeared in a typical resting phenotype with thin, spindly processes. After LPS treatment (B, D), the microglia in both genotypes appeared reactive with thicker processes. GFAP, a marker for activated astrocyte, increased only in Atm −/− mice (H) but not in Atm +/+ mice (F) under LPS treatment. The quantification of occupied area by Iba-1 (I) and GFAP staining (J). Scale bar = 50 µm.

