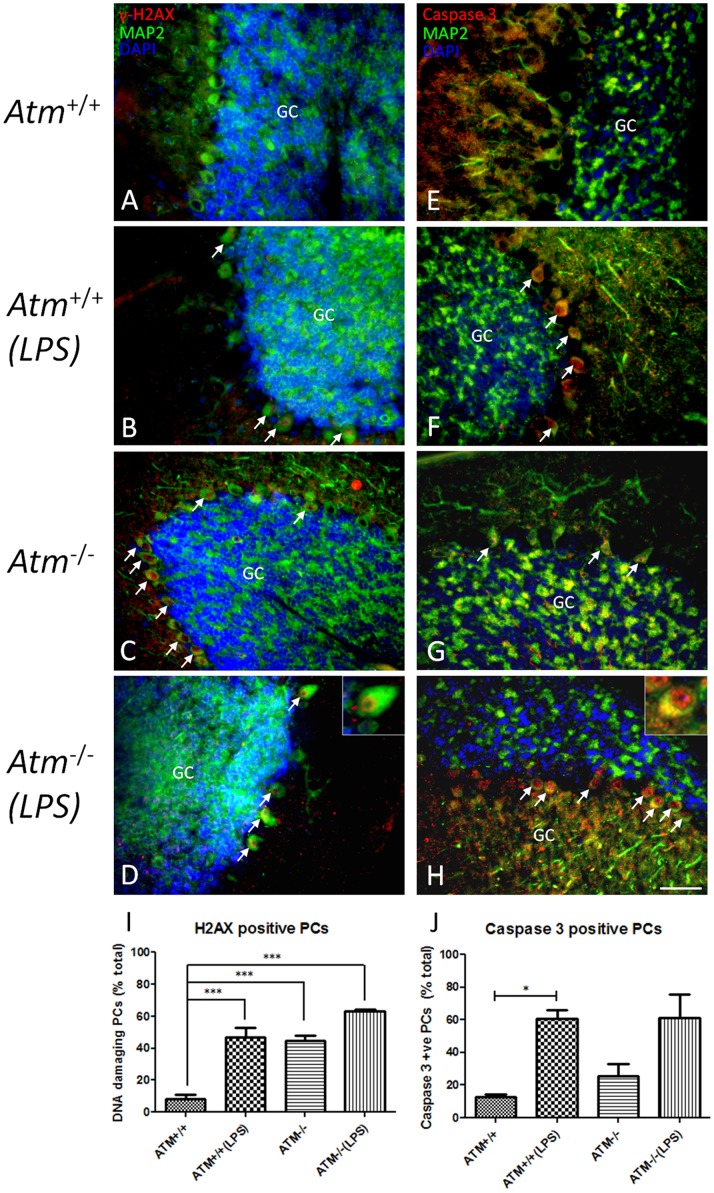
Figure 5. DNA-damage and apoptotic cell markers in Atm−/− and wild type mice after LPS treatment.
The representative pictures from each group (n = 3) were shown. Nuclear localizations of γ-H2AX (red, A–D) and cleaved caspase 3 (red, E–H) were identified in saline-treated Atm−/− mice (C, G) but not in Atm+/+ mice (A, E). Map2 staining (green) was used to identify Purkinje cells. Cell nuclei were revealed with a DAPI (blue) counterstain. Quantification of marker-positive Purkinje cells for γ-H2AX (I) and cleaved caspase 3 (J) was performed. In panels A–H, white arrows indicate the Purkinje cells that stained with respective protein markers. Scale bar = 50 µm.

