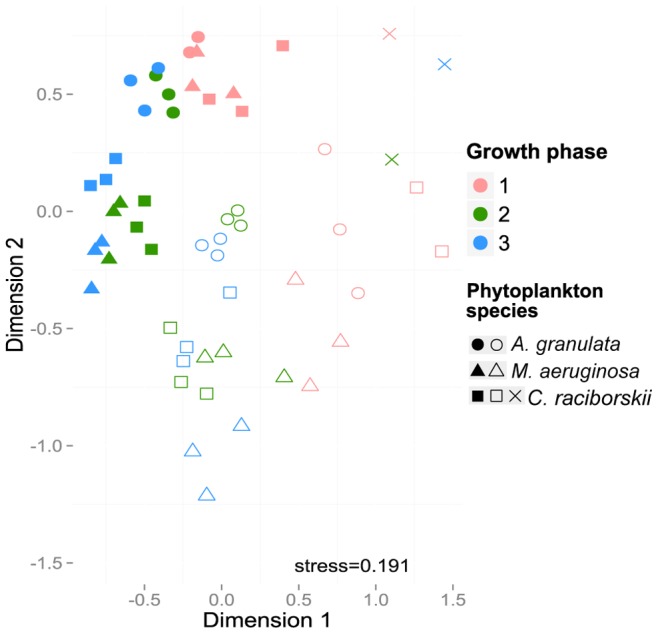
Figure 4. Non-metric multidimensional scaling (NMDS) plot showing differences among bacterial communities by phytoplankton species, fraction and growth phase.

Solid and open symbols represent, respectively, free-living and attached communities. The crosses represent Cylindrospermopsis raciborskii controls. 1 = lag or beginning of exponential growth phase, 2 * = exponential growth phase, 3* = stationary growth phase. * To C. raciborskii 2 and 3 were stationary and senescent phases, respectively.
