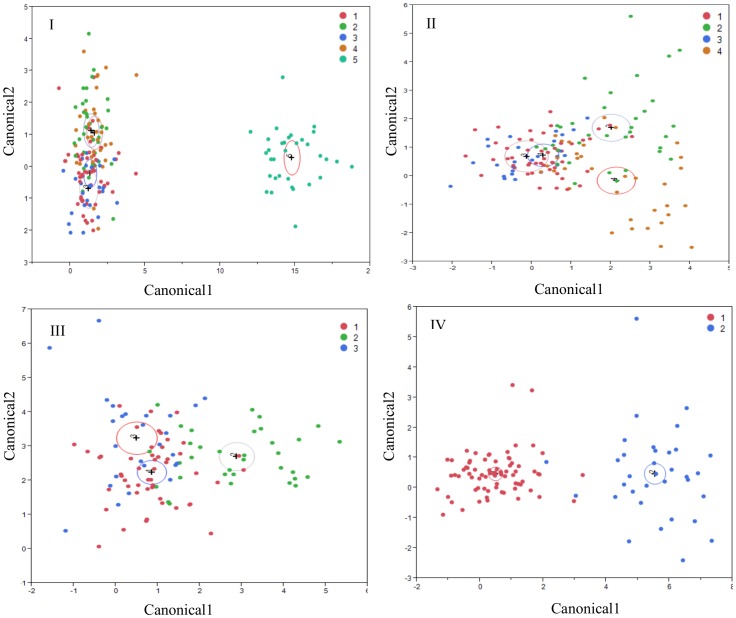
Figure 2. Discriminant analyses of milk samples microbiome.
I. Discriminant analysis that was performed using all 5 groups of milk samples (1 = healthy quarter, somatic cell count < 20,000; 2 = healthy quarter, somatic cell count ranged from 21,000 to 50,000; 3 = healthy quarter, somatic cell count >50,000; 4 = subclinical culture positive quarters, somatic cell count>400,000; 5 = clinical mastitis culture negative quarters). II. Discriminant analysis that was performed after excluding samples derived from clinical mastitis, culture negative quarters (group 1–4 included). III. Discriminant analysis performed using groups 1–3. IV. Discriminant analysis of milk microbiome from healthy quarters (groups 1–3) by farm (farm A and B). All discriminant analyses were performed in JMP Pro (SAS Institute Inc. North Carolina) using the bacterial genus prevalence in each sample as covariates and the sample group (I, II, III) or farm (IV) as the categorical variable. Only genera significant for the discrimination were included in the final models. Groups are colour coded in each figure. The center of gravity for each group is represented by a + sign and variability by a circle.

