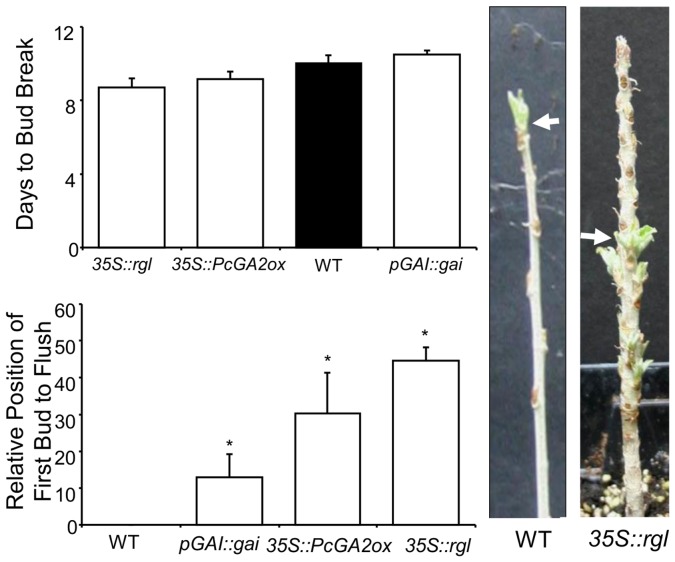
Figure 7. Bud flush in transgenic and WT Populus.
Arrows point to the first bud to flush. Bars indicate mean±SE of at least three biological replications. Relative position of the first bud to flush was expressed as percent of buds from the top of the plant, 0% being the apex of the plant and 100% being the very bottom bud (closest to the soil). Significant differences between transgenic and WT treatments were determined by one-way ANOVA followed by Dunnett’s post-hoc test (*, P<0.05).

