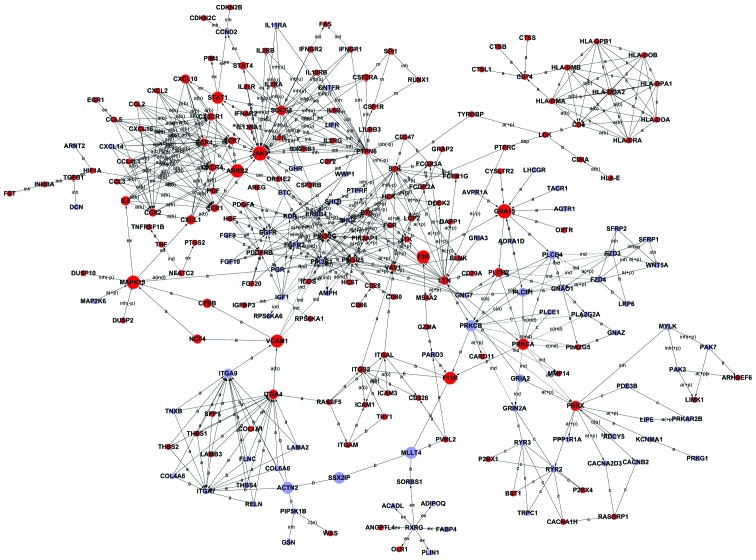
Figure 4.
Signal transduction networks of CTEPH-related genes. Circles represent genes, red circles represent upregulated genes, and blue circles represent downregulated genes. Arrows represent the activation of (a); straight line represents combinations; dotted line represents indirect effects; a, represents activation; ex, represents gene expression; b, represents binding; c, represents compound; ind, represents indirect effects; inh, represents inhibition; u, represents ubiquination, s, represents state change; detailed annotation listed in Table VII.

