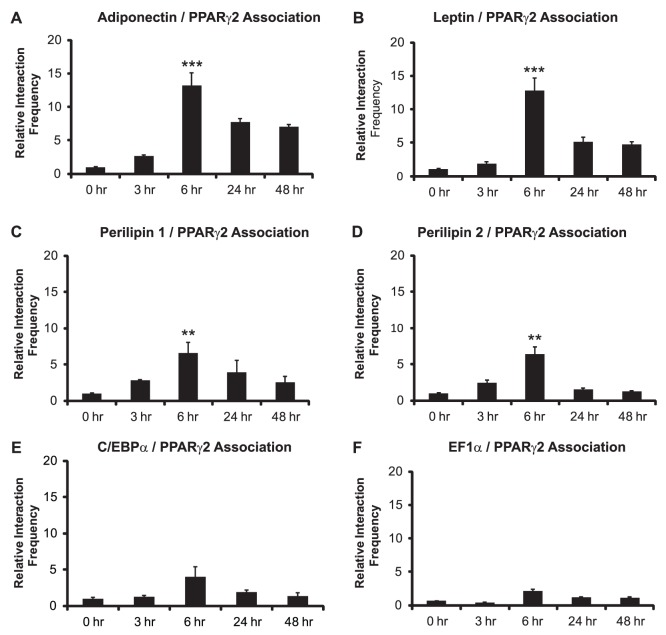
Figure 2. The PPARγ2 promoter maximally interacts with adipokine and perilipin gene promoters in C3H10T1/2 cells 6 hours post-differentiation.
3C assays were performed at the indicated times to measure long-range, intergenic interactions between the PPARγ2 promoter and (A) the adiponectin promoter, (B) the leptin promoter, (C) the perilipin 1 promoter, (D) the perilipin 2/ADRP promoter, (E) the C/EBPα promoter, or (F) the EF1α promoter. Interaction frequencies are presented relative to the intragenic interaction frequency observed between different regions of the TFIIH locus, which served as a normalization control. The interaction frequency at 0 h was set to 1; the interaction frequencies for the remaining time points are presented relative to that value. Results indicate the average of three independent experiments +/− standard deviation. Values for the timepoint of maximum interaction frequency (6 h) were compared to values at time 0 by one-tailed t-test. ***p<0.001; **p<0.01.

