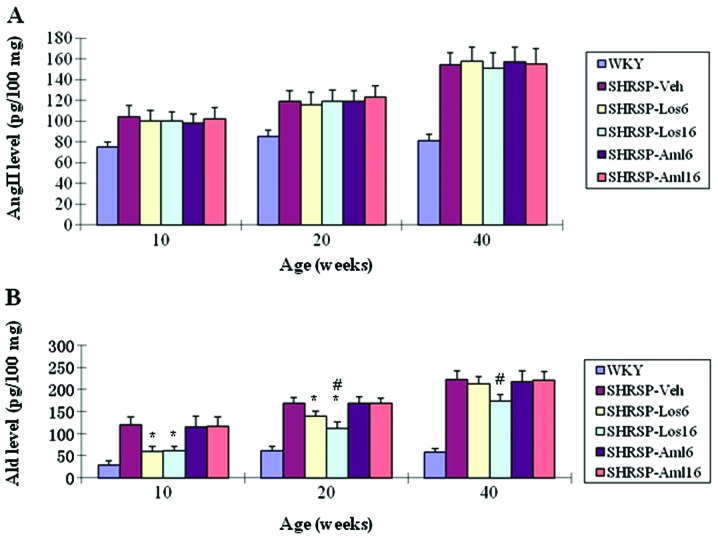
Figure 5.
Changes in the levels of angiotensin II (Ang II) and aldosterone (Ald) in the cerebral cortex of Wistar Kyoto rats (WKY), stroke-prone spontaneously hypertensive rats (SHRSP)-Veh and the four drug treatment groups at different ages (weeks). (A) Ang II was measured using radioimmunoassay on brain tissues collected from each of these groups. No significant changes were observed between SHRSP-Veh and any of the four drug treatment groups. n=8/group. (B) Ald was measured using radioimmunoassay on brain tissues collected from each of these groups. *P<0.05, compared with SHRSP-Veh; #P<0.05, compared with SHRSP-Los6. The comparisons were made between groups of the same age as indicated. Note that there is a significant difference between WKY and any of the SHRSP groups.

