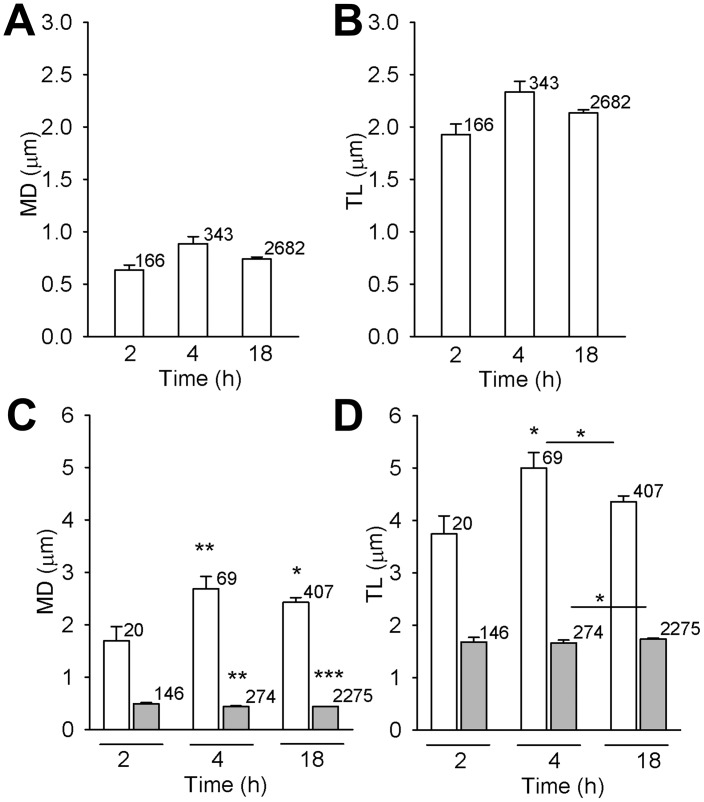
Figure 5. MD and TL of DiD-labelled TBEV vesicles exhibiting directional mobility increased with time p.i..
Average MD and TL of all vesicle periods are represented in panels A and B. No significant difference was observed neither between MD (in µm) at different times p.i.: 0.63±0.05 (2 h), 0.89±0.07 (4 h), 0.74±0.05 (18 h) (A), neither between TL (in µm): 1.93±0.10 (2 h), 2.23±0.10 (4 h), 2.13±0.03 (18 h) (B). However, a significant increase was observed for MD (in µm) for DM periods (white bars): from 1.69±0.27 (2 h) to 2.68±0.23 (4 h; **P<0.01) and 2.42±0.09 (18 h; *P<0.05) and small, but significant decrease for NDM periods: 0.48±0.02 µm (2 h), 0.43±0.01 µm (4 h) and 0.44±0.001 µm (18 h) (**P<0.01, ***P<0.001 (grey bars) (C). Mean TL (in µm) of DM periods (white bars) slightly, but significantly increased from 3.74±0.35 (2 h) to 5.00±0.29 (4 h; *P<0.05) while of NDM remained similar: 1.68±0.09 (2 h), 1.66±0.06 (4 h) and 1.74±0.02 (18 h) (D). n = number of vesicles.

