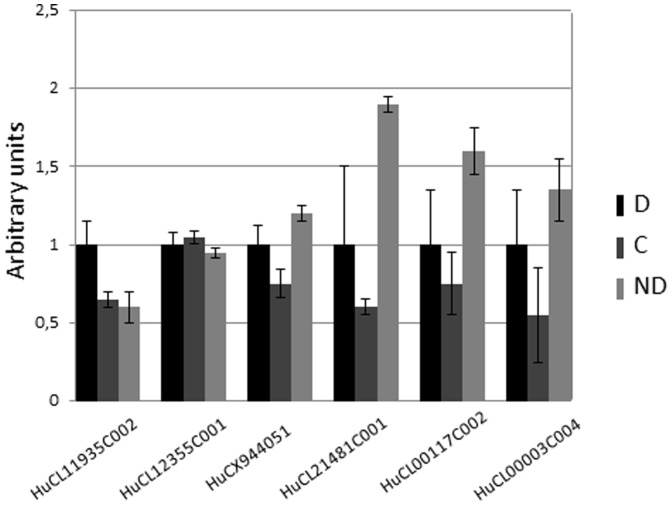
Figure 3. Real-time quantitative PCR analysis of transcripts altered during dry after-ripening.
Transcript abundance in after-ripened control (C) and non-dormant (ND) seeds relative to that found in dormant (D) embryos to which the value 1 is assigned. HaEF1, Haβ-tubulin [12] and HaS19 were used as reference genes. Bars represent means ± standard deviation of three biological replicates.

