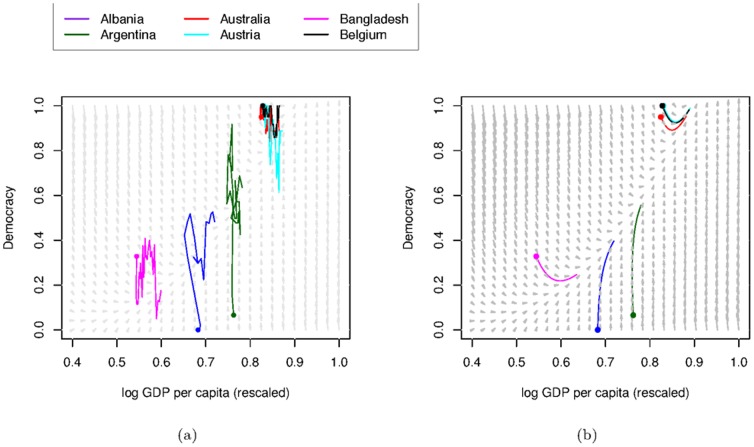
Figure 5. Phase portraits with trajectories.
From (a) country by country data and (b) model predictions made by integrating equations 7 and 9, with coloured circles representing the initial conditions. The arrows in the phase portrait indicate the direction and magnitude of the changes  and
and  as a function of the two variables
  and
and  themselves. Specifically the arrows are the vector
  given by equations 7 and 9. These arrows are the same in both sub-figures.

