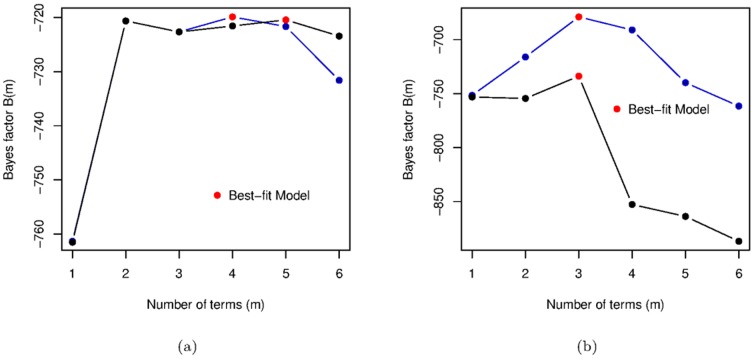
Figure 6. Choosing the best models.
(a) Bayes factors for the two-variable  models (black) and for the three-variable
  models (violet). The two red marked models refer to equation 8 and equation 12. (b) Bayes factors for the two-variable
  models (black) and for the three-variable
  models (violet). The two red marked models refer to equation 9 and equation 13. In both cases, the Bayes factor for the two and three variable models are calculated over the same subset of data, which is (necessarily) one year shorter than that used in Fig. 2 and Fig. 4.

