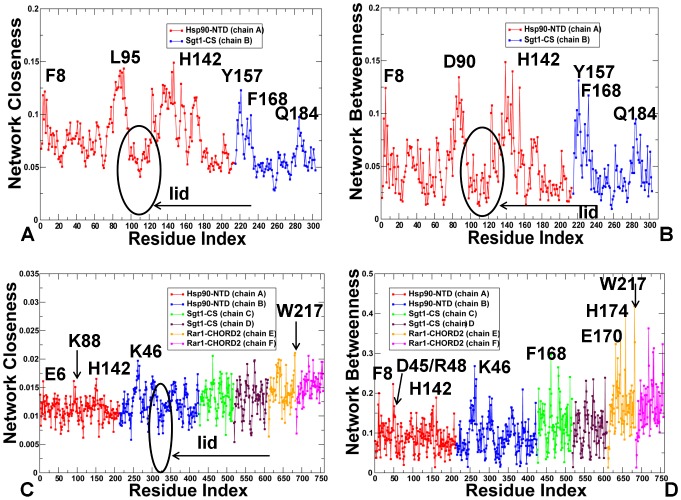
Figure 9. The Centrality Analysis of the Interaction Networks in the Hsp90-Sgt1 and Hsp90-Sgt1-Rar1 Complexes.
The residue-based centrality parameters: closeness (A, C) and betweenness (B, D) of the Hsp90-Sgt1 and Hsp90-Sgt1-Rar1 complexes. In (A) and (B) the centrality profile for the Hsp90-NTD residues is shown in red lines, and for the Sgt1-CS residues in blue lines. In (C) and (D) the centrality profile for the Hsp90-Sgt1-Rar1 residues is also colored according to their domain annotation. The Hsp90-NTD molecules are in red/blue; the Sgt1-CS molecules in green/brown; and the Rar1-CHORD2 molecules in orange/magenta. The peaks in the centrality profiles corresponding to the functional hot spot residues of the Hsp90 activity are annotated and pointed by arrows. The lid residues in the Hsp90-Sgt1 and Hsp90-Sgt1-Rar1 complexes are highlighted and pointed to by oval circles surrounding the lid. To streamline the comparison with structural and functional experiments, we annotated functional residues according to their original numbering in the crystal structures.

