
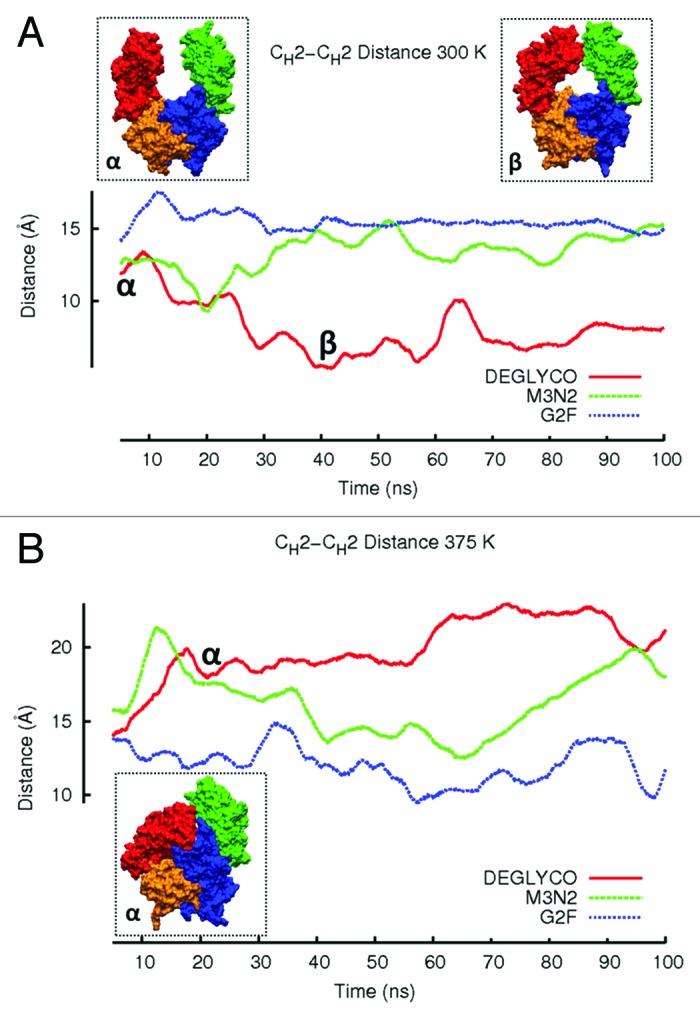
Figure 3. The average CH2-CH2 distance during simulations at (A) 300 K and (B) 375 K is plotted. Distances are averaged over a 5 ns window and plotted in the window center. Even though glycoform variant starting structures are the same, initial CH2-CH2 distances for the three glycoform variants are slightly different because the first data points reported are at 2.5 ns due to averaging. Figure insets (α) and (β) represent DEGLYCO structures along the trajectory. At 300 K, simulations began with DEGLYCO in an open conformation. As DEGLYCO simulations progressed, the CH2-CH2 distance decreased and the FcR binding site closed. At 375 K, the CH2-CH2 distance increased as CH2 domains collapsed onto CH3 domains. The FcR binding site was also closed in the collapsed structure.