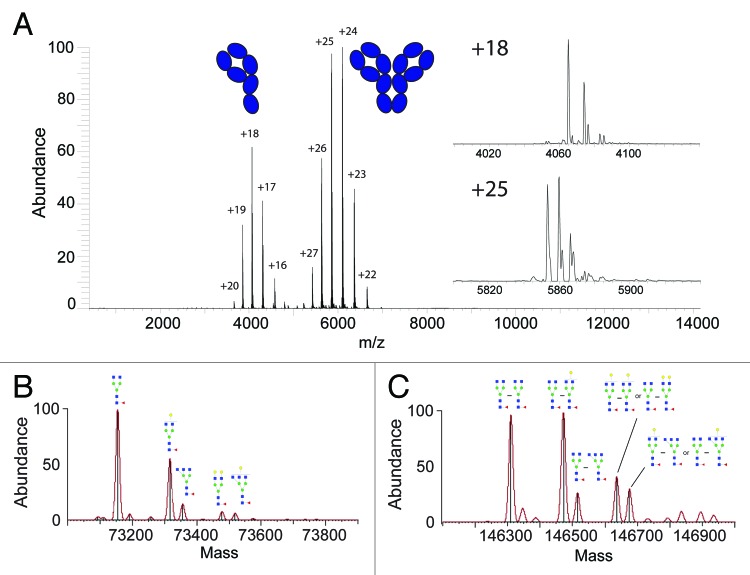
Figure 1. Antibody glycosylation analysis at the intact protein level by native Orbitrap MS. In (A) the full native mass spectrum of an ΔhingeIgG4WT antibody is shown, revealing two charge-states envelopes originating from the half- (~m/z 4000) and full-antibody (~m/z 6000) being in equilibrium. The in-sets show enlarged single charge state spectra for both the half- and full-antibody, highlighting the micro-heterogeneity caused by glycosylation. The convoluted zero-charge mass spectra and glycan assignments, of the major components, are shown for the half-antibody in (B) and the full-antibody in (C). In case of more than one possible schematic structure for a (Neu5Aca)(Galb)MancGlcNAcdFuce composition, only one isoform is included; additional isomeric structures are displayed in Figure S4

An official website of the United States government
Here's how you know
Official websites use .gov
A
.gov website belongs to an official
government organization in the United States.
Secure .gov websites use HTTPS
A lock (
) or https:// means you've safely
connected to the .gov website. Share sensitive
information only on official, secure websites.
