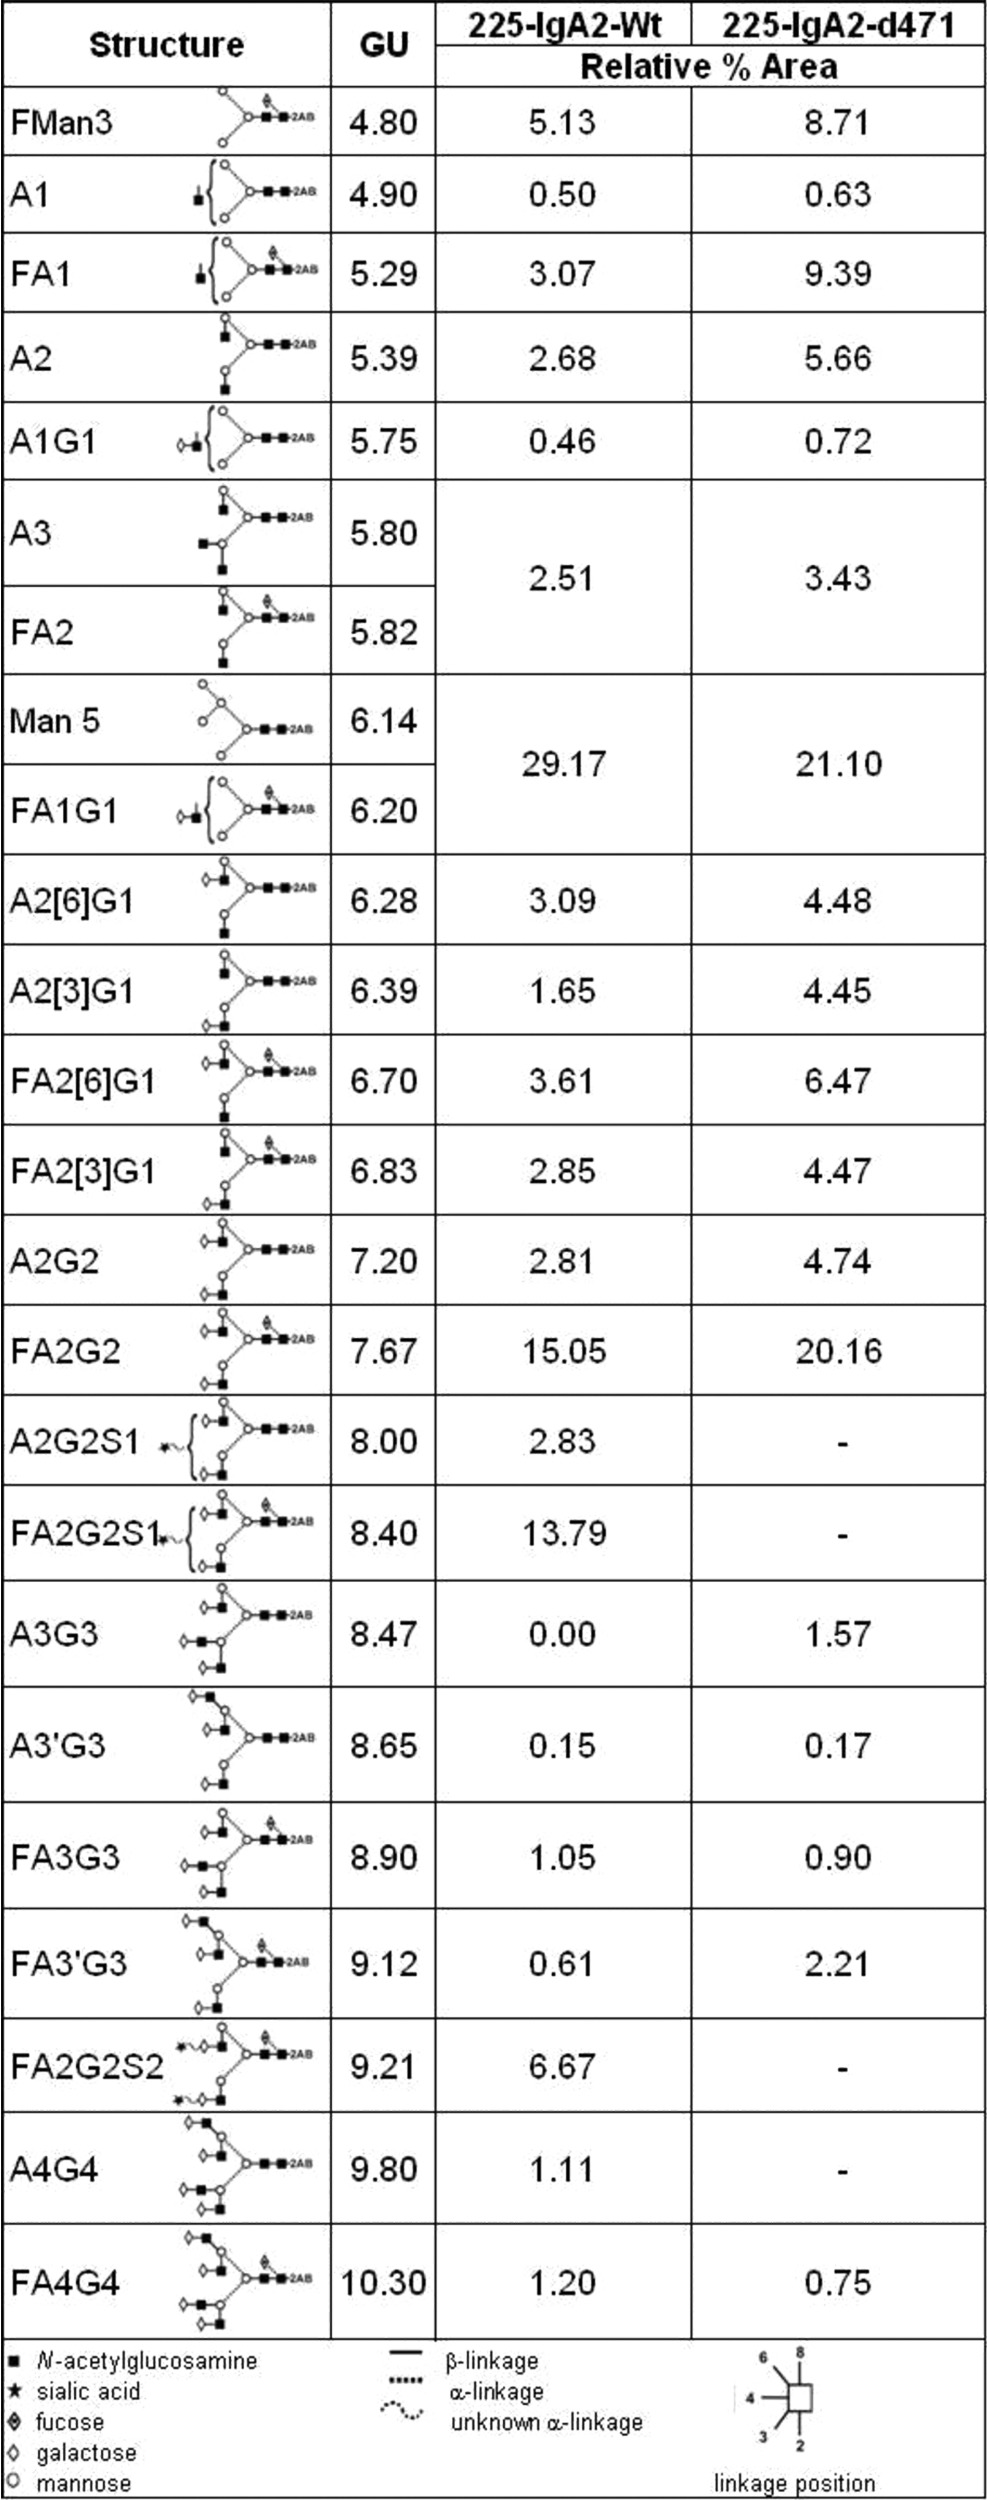
Table 1. Summary of relative proportions of major N-glycans identified for 225-IgA2-wt and –d471.

Data were obtained from the percentage areas following exoglycosidase digestion and HILIC-UPLC analysis. Structures are annotated by oxford nomenclature and a schematic illustration. Glucose unit (GU) values are related to the specific retention time on gel filtration. Data are presented as relative area under curve (%)
