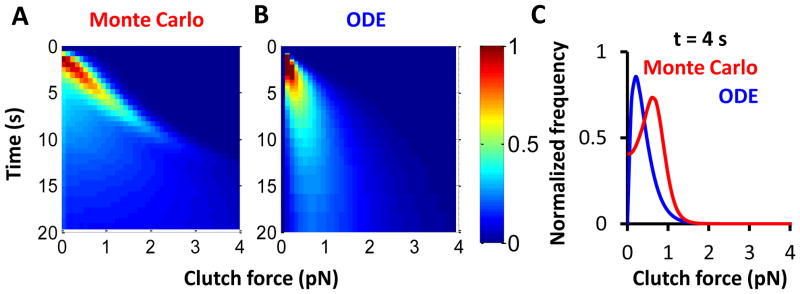
Figure 3. Force distribution on molecular clutches.

A) and B) each present two-dimensional histograms of clutch forces over time for both Monte Carlo and ODE motor-clutch cycles. The color coding indicates the frequency of observation. At short times, low clutch forces are frequent, but this distribution broadens over time. The mode also shifts to higher forces as time progresses. The gamma distribution used for the ODE solution maintains a tighter distribution than the output of the Monte Carlo simulations. Monte Carlo simulations were run for 10,000 cycles to obtain the distribution, and the ODE solution is for r = 2. C) Cross-sections of both force distributions at t = 4 s show good qualitative agreement, but again the ODE solution distribution is tighter than the Monte Carlo output.
