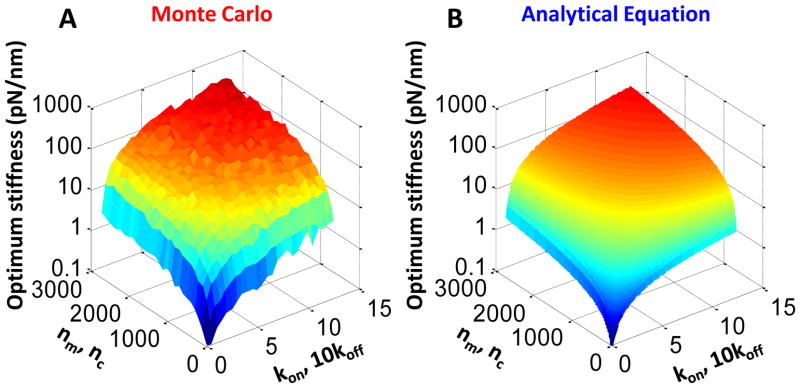
Figure 5. Analytical optimum stiffness.
A) Maintaining the balance of nm = nc and kon = 10koff, the parameters were altered to change the optimum stiffness of the Monte Carlo output (as defined by the stiffness at which traction force is maximum). The presented changes in these parameters result in nearly a four order of magnitude shift in the optimum stiffness. B) Again maintaining the parameter relationships of nm = nc and kon = 10koff, the analytical solution for optimum stiffness (Eqn. 30) behaves very similarly to the Monte Carlo output.

