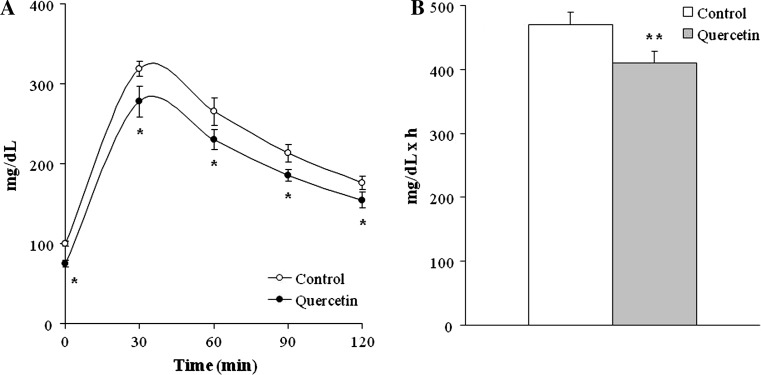
Fig. 1.
Glycemic response in glucose tolerance test (a) and area under the curve (AUC) of glucose tolerance test (b) of rats from Control and Quercetin-treated groups (n = 9 per group). Values are mean ± SEM. Differences between groups were determined by Student’s t test. Statistical significance was set at the P < 0.05 level. *P < 0.05

