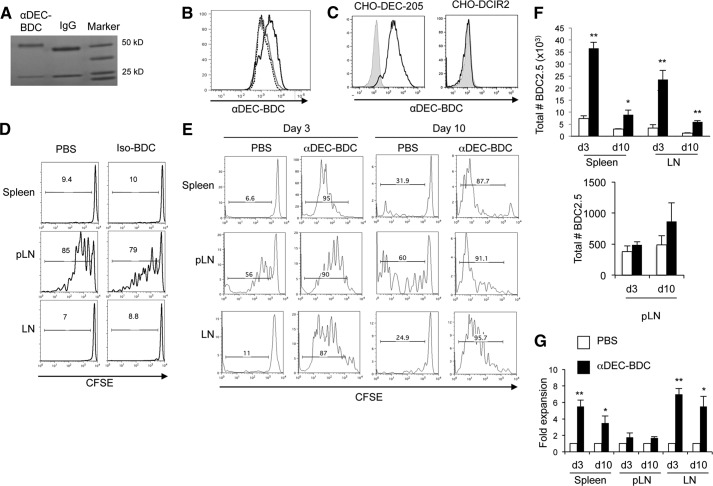
Figure 1. Targeting of a BDC-mimetope peptide to DEC-205+ DCs induces T cell expansion not tolerance.
(A) GelCode Blue staining of SDS-PAGE of αDEC-BDC and control IgG in a reduced gel, showing the increase in size of the chimeric antibody heavy chain (near 50 kDa) as a result of peptide addition. (B) αDEC-BDC staining on CD11c+CD8+ cells (black solid) and CD11c+CD11b+ cells (gray solid) or secondary-only staining on CD11c+CD8+ cells (black dashed) from spleen. (C) αDEC-BDC binding to CHO cells that stably express DEC-205 (left) or DCIR2 (right). (D) CFSE-labeled CD4+ T cells from BDC2.5 Thy1.1+ mice were transferred to NOD mice followed by treatment with PBS or Iso-BDC, and BDC2.5 T cells from lymphoid tissues were analyzed at Day 3. (E) CFSE-labeled CD4+ T cells from BDC2.5 Thy1.1+ mice were transferred to NOD mice followed by treatment with PBS or αDEC-BDC. Spleen, pLNs, and peripheral LNs were recovered at Day 3 or Day 10 after stimulation, and BDC2.5 T cells were assessed for proliferation by CFSE dilution. Histograms are gated on lymphocytes/live cell marker/CD4+/Thy1.1+ cells. Number above the bar indicates the percentage of CFSElo BDC2.5 T cells. (F) Total number of BDC2.5 T cells in spleen, pLN, and LN after PBS or αDEC-BDC at the indicated time-points. (G) Fold expansion of BDC2.5 T cells stimulated by αDEC-BDC compared with unstimulated (PBS-treated) BDC2.5 T cells at the indicated time-points. Proliferation was assessed by the number of CFSElo cells. Data are representative of five (E–G), three (B and C), or two (D) experiments. Error bars represent + sem (F and G). *P < 0.05 compared with PBS control; **P < 0.005 compared with PBS control.

