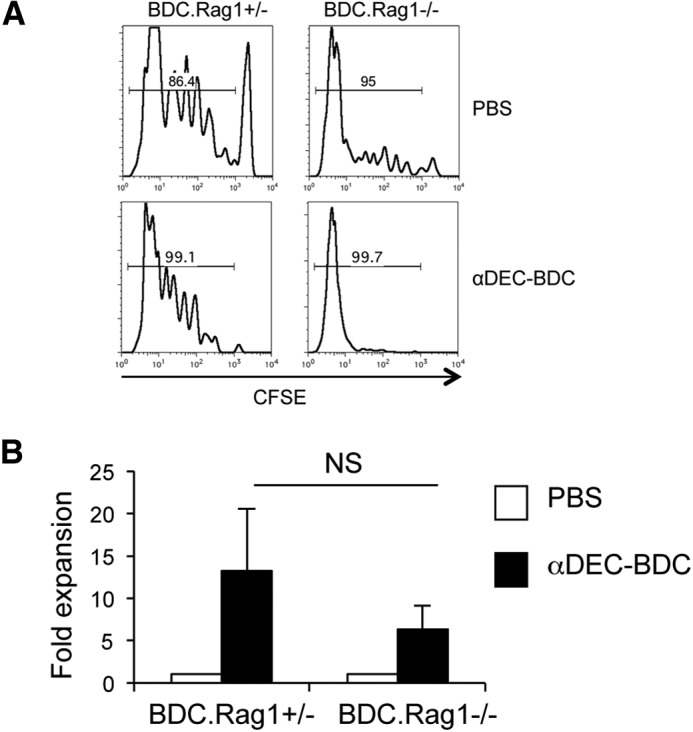
Figure 3. Monospecific BDC2.5 T cells respond similarly to total BDC2.5 T cells.

(A) CD4+ T cells were obtained from 2-week-old BDC2.5.Rag1+/− and BDC2.5.Rag1−/− mice, transferred to NOD.Thy1.1 mice, and then treated as indicated. After 10 days, LN cells were recovered, and BDC2.5 cell division was assessed by CFSE dilution. Percentage above the histogram is the percent of CFSElo BDC2.5 T cells. (B) Fold expansion of BDC2.5 T cells from Rag1+/− or Rag1−/− mice compared with cell numbers from PBS-treated mice. Data are the average of two experiments + sem.
