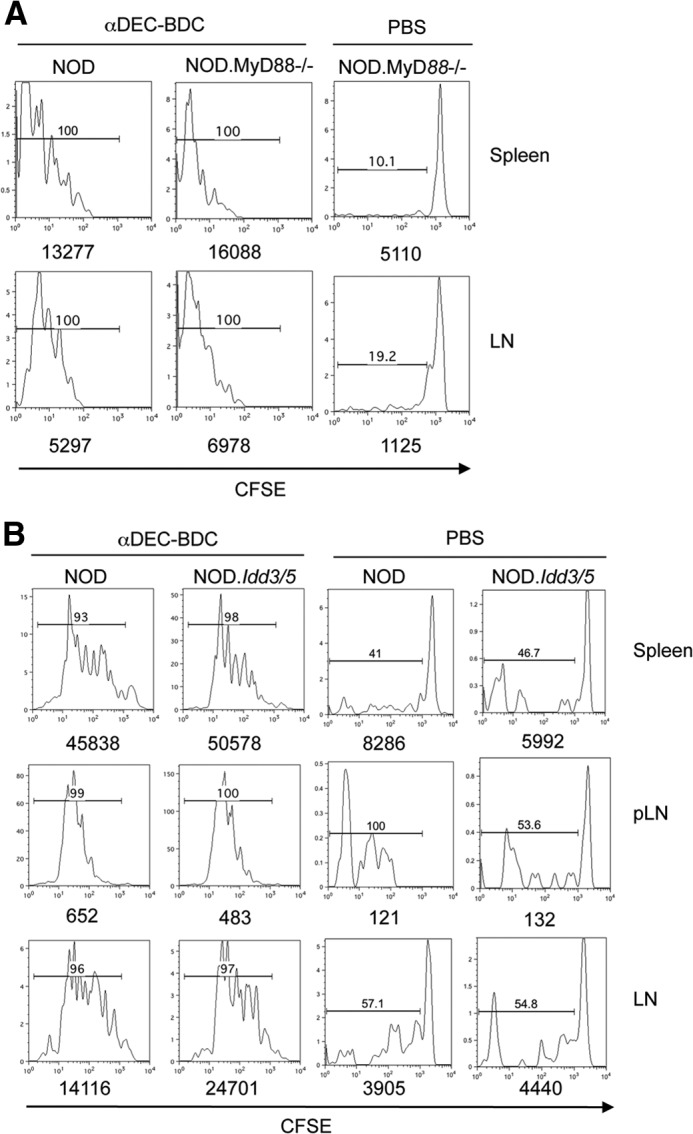
Figure 4. Antigen-targeted CD8+ DCs from NOD.MyD88−/− or NOD.Idd3/5 mice induce similar T cell responses to CD8+ DCs in NOD mice.

(A) BDC2.5 T cells were transferred to NOD or NOD.MyD88−/− mice, followed by PBS or αDEC-BDC treatment. After 10 days, BDC2.5 T cells in spleen and LNs were examined for proliferation based on CFSE dilution. The number above the bar is the percentage of BDC2.5 T cells that are CFSElo. Numbers below the graph are the total number of BDC2.5 T cells. (B) BDC2.5 T cells were transferred into NOD or diabetes-resistant NOD.Idd3/5 mice and then treated as indicated. Spleen, pLN, and LN cells were obtained at Day 10 and assessed for percentages of divided BDC2.5 T cells. Data are each representative of two independent experiments.
